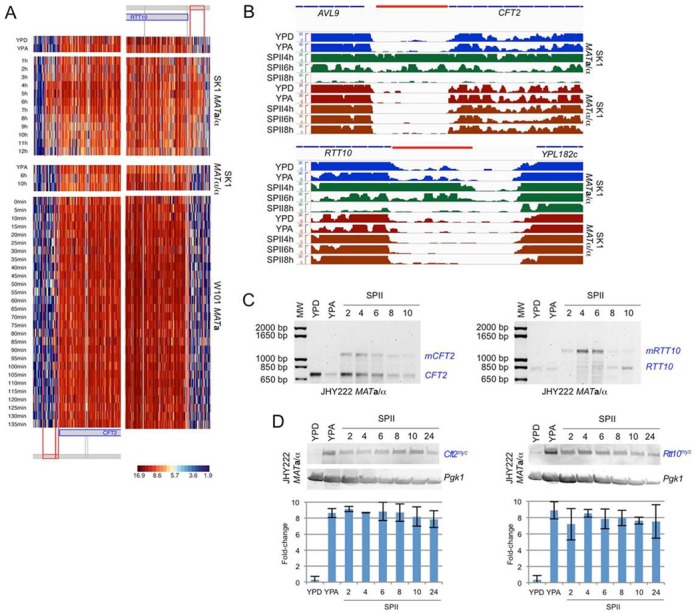
Figure 3.

RTT10 and CFT2 early meiosis-specific isoform expression. (A) Heatmaps are shown for 5′-regions of CFT2 and RRT10 that contain predicted URS1 motifs. Blue rectangles are ORFs. Segments corresponding to the extended 5'-UTRs are shown in red. The raw output of the segmentation algorithm is shown in grey. Samples and strains are indicated. The log2 scale is given. (B) Histograms representing RNA-Seq data (not DNA strand specific) obtained with diploid SK1 WT and control strains are shown. Data on reads are presented on a linear scale (y-axis). RNA was isolated from fermenting (YPD), respiring (YPA) and sporulating (SPII 4, 6, 8 h) cells as indicated. Mitotic samples from the WT strain are given in blue, meiotic samples are given in green. Samples from the control strain are shown in red. Thin blue lines represent the ORFs, and a red line represents the 5′-mUTR extension (based on DNA strand-specific tiling array data). (C) 5′-RACE data are shown for CFT2 and RTT10 isoforms as indicated. Molecular weight markers (MW) are given in bp. Cells were cultured in rich medium (YPD) or sporulation medium (SPII, 2, 4, 6, 8 and 10 h). (D) A western blot is shown for Cft2 and Rtt10 containing a C-terminal myc tag (Cft2myc, Rtt10myc) in rich media (YPD, YPA) and sporulation medium at the time points indicated (SPII). Pgk1 was used as a loading control. Histograms show the fold-change of signal intensities determined in triplicate relative to the loading control (y-axis) versus the samples (x-axis); error bars of the SD are given.
