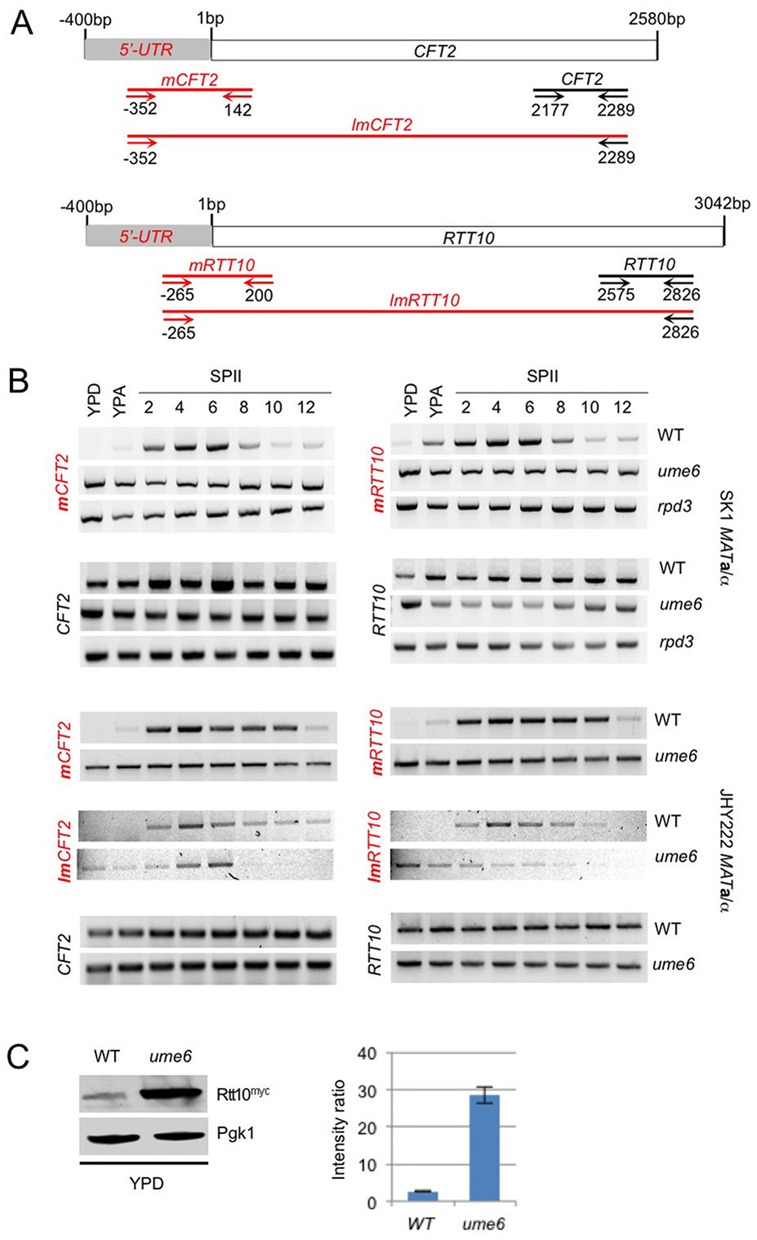
Figure 4.

Early meiotic isoform expression in rpd3 and ume6 mutants. (A) A schematic shows 5′-UTRs and ORFs as grey and white rectangles. Sequence length is indicated in bp. Diagnostic PCR fragments are shown as red and black lines covering meiotic and mitotic isoforms, respectively. Small arrows represent forward and reverse PCR primers for which the coordinates are given in bp. To assay the meiotic isoforms we used two primer combinations that reveal mUTRs and cover short (mCFT2, mRTT10) or long (lmCFT2, lmRTT10) ORF regions as indicated. (B) The output of RT-PCR assays for SK1 WT and mutant (ume6, rpd3) strains, and JHY222 WT and ume6 strains is shown for mitotic transcripts (given in black) and meiotic isoforms detected with two primer pairs (red). (C) A western blot is shown for myc-tagged Rtt10 (Rtt10myc) detected in duplicate samples from WT and Ume6 deletion (ume6) strains cultured in rich medium (YPD). Pgk1 was used as a loading control. A histogram is shown as in Figure 3D.
