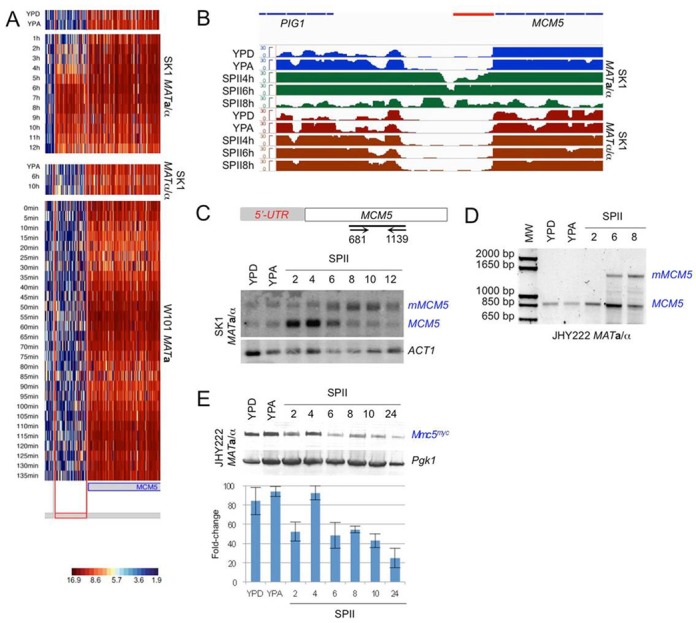
Figure 5.

MCM5 middle meiosis-specific isoform expression. (A and B) Heatmaps and RNA-Seq data for MCM5 are given as in Figure 3. (C) A schematic shows the Northern blot target locus and primer positions within the ORF. Mitotic (MCM5) and meiotic (mMCM5) isoforms are given. ACT1 was used as a loading control. (D) 5′-RACE PCR data are shown for MCM5 isoforms in rich media (YPD, YPA) and three samples covering the induction of the meiotic isoform (SPII 2, 6, 8 h). (E) A western blot is shown for myc-tagged Mcm5 (Mcm5myc) from samples as in panel C except that the 12-h time point in SPII was replaced by a 24-h time point. Pgk1 was used as a loading control. A histogram is shown as in Figure 3D.
