Figure 8.

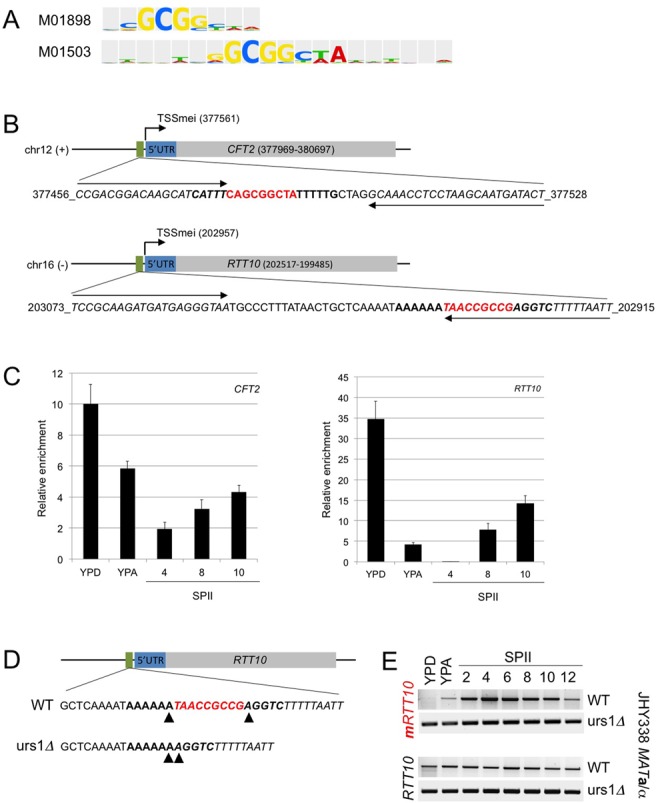
Ume6 in vivo binding to predicted URS1 sites and URS1 deletion in the RTT10 promoter. (A) The logos of two PWMs for the URS1 motif provided by TRANSFAC are shown. The PWM identifier is given to the left. (B) Schematics of the regions containing the predicted URS1s (green rectangle), the UTRs (blue) and the ORFs (grey) are shown. Black lines represent DNA. Chromosome numbers and DNA strands (+, −) are given, and the genome coordinates of the meiotic TSS (TSSmei), the target sequence used for ChIP and the ORF segments are shown. Matches to the complete PWM are given in bold, core URS1 sequences are shown in red. Bases covered by the Q-PCR primers are given in italics. The primer locations are indicated by arrows. (C) Bar diagrams are given of fold-enrichment (y-axis) for the CFT2 and RTT10 promoters relative to the NUP85 coding region versus samples from three biological replicates cultured in rich media (YPD, YPA) and sporulation medium (SPII, 4, 8 and 10 h; x-axis). The error bars represent the standard deviation. (D) A schematic drawing represents the RTT10 ORF (grey bar), its 5′-UTR (blue) and the precise DNA sequences of strains bearing the WT sequence and the motif deletion (urs1Δ). Arrowheads mark the bases that border the URS1 motif. (E) RT-PCR data showing target gene expression using primers that probe the ORF (RRT10) or the 5′-mUTR (mRRT10) in samples prepared from diploid strains bearing the WT or the mutated promoter (urs1Δ) as indicated. Samples are as in Figure 3. The experiment was done in strains derived from JHY336 and JHY337 that bear the URA3 auxotrophic marker (see Supplemental Additional Table 1).
