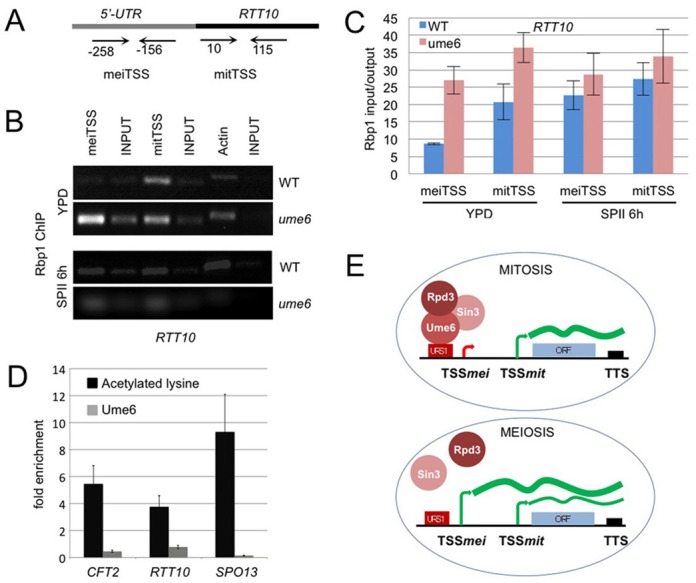
Figure 9.

RNA Polymerase II subunit Rpo21/Rbp1 in vivo binding and Rpd3 HDAC activity. (A) A schematic shows the locus and the primer positions for mitotic and meiotic TSSs as indicated. (B) RT-PCR-amplified DNA is shown from a ChIP assay revealing RNA polymerase II binding to the mitotic TSS (mitTSS), the meiotic TSS (meiTSS) versus total chromatin (INPUT). Actin was used as a control. Samples were prepared from WT and Ume6 mutant strains (ume6) cultured in rich medium (YPD) or sporulation medium for 6 h (SPII 6 h). (C) A colour-coded bar diagram shows the input/output ratio (y-axis) versus the target TSSs in the media bound in WT (blue) and mutant (red) strains as detected by Q-PCR. The standard deviation is given. (D) Black bar diagrams show the fold-increase (y-axis) of lysine acetylation in an rpd3 mutant as compared to a WT strain for three target genes (x-axis). The standard deviation of two independent biological replicates is given. Light grey bars represent Ume6 binding. The CFT2 and RTT10 target genes were compared to the SPO13 locus, which is repressed in mitosis by Ume6/Rpd3/Sin3. The primers used for CFT2 and RTT10 were the same as in Figure 8C, the primers used for SPO13 were described in (51). (E) The drawing depicts the tripartite repressor complex during mitosis (top) and in early meiosis (bottom) where the DNA binding subunit Ume6 is temporarily degraded by the APC/C. TSSs active during mitosis (TSSmit) or meiosis (TSSmei) are symbolized by arrows. The transcription termination site (TTS) is represented by a black rectangle. A red rectangle indicates the URS1 regulatory motif. A black line is DNA, ORFs are represented by blue rectangles. mRNAs at different concentrations are shown as bold and thin green lines.
