
Figure 1.
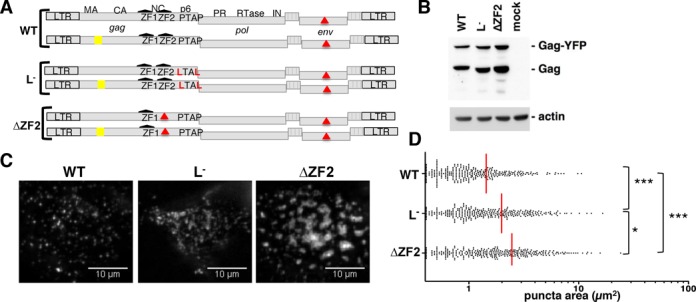
Study of ΔZF2 HIV-1 biogenesis in living cells by TIRFM. (A) Series of pairs of HIV-1 vectors (untagged/tagged-YFP) expressed in HeLa cells to visualize biogenesis of WT and mutant HIV-1 at the cell surface. YFP was incorporated into the stalk region of MA as previously described (41) (Text S7). The two ZFs of the NC are depicted in black and mutations are in red. (B) Anti-CA western blotting analysis of total Gag and Gag-YFP in cells used in TIRFM experiments (Text S7). (C) Representative TIRFM images showing Gag expression at the surface of live cells captured 14 h after transfection. For each virus, at least 50 cells with >50 events/cell were analyzed from three independent transfections. (D) Scatter plot of the area of 300 individual fluorescent puncta randomly selected. Red line indicates the mean value of the area. *P < 0.1; ***P < 0.001, as determined by the Mann–Whitney U-test.