
Figure 4.
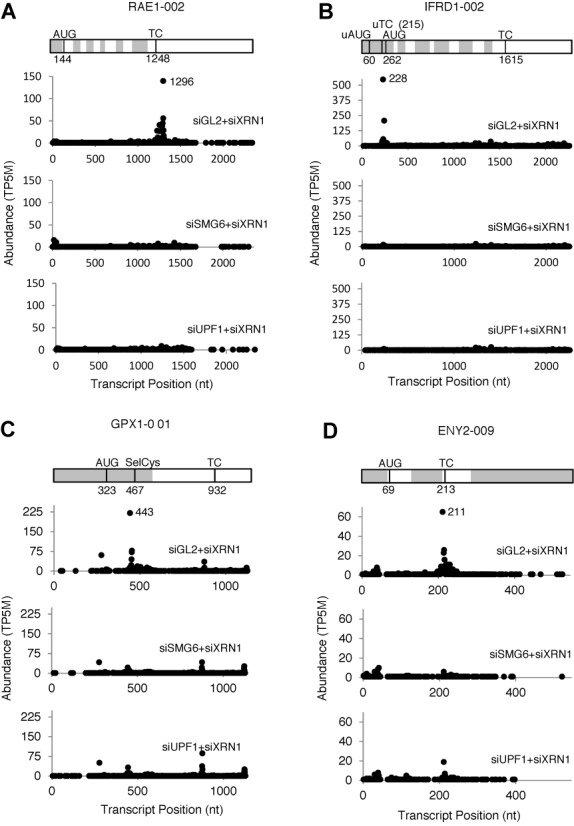
Representative D-plots of endogenous SMG6 targets identified by PARE. A transcript map is shown above each set of D-plots. Alternating gray and white zones represent exons. AUG, translation initiation codon; TC, natural termination codon; uAUG, predicted translation initiation codon of an upstream ORF; uTC, predicted termination codon of an upstream ORF; SelCys, selenocysteine codon. (A) RAE1–002, a transcript with a long 3′ UTR. (B) IFRD1–001, a transcript with a predicted uORF. (C) GPX1–001, a transcript with a selenocysteine codon. (D) ENY2–009, a transcript with an exon junction downstream of the TC. All of the D-plots were drawn with data from Biorep 1; similar effects were observed for Biorep 2.