
Figure 6.
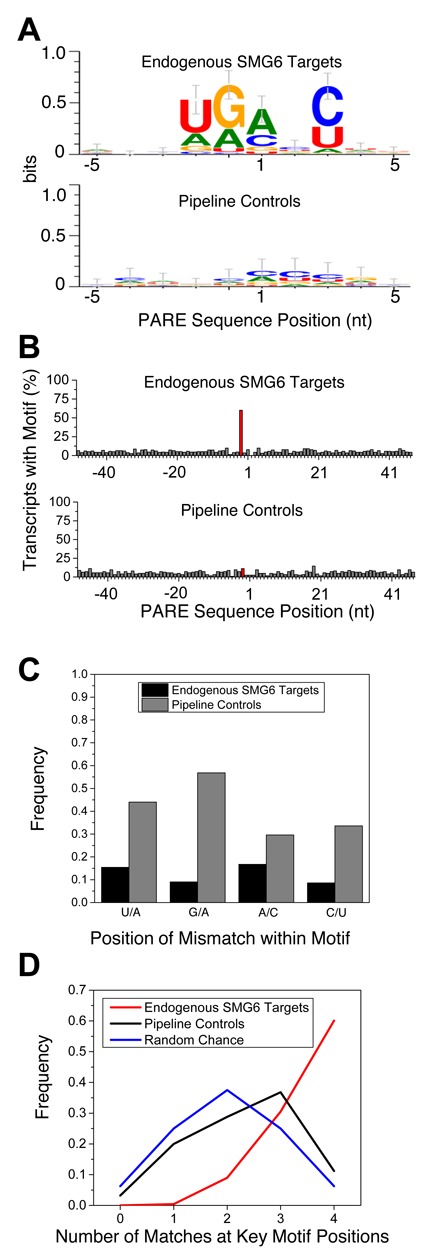
Degenerate pentameric motif common at SMG6 cleavage sites. (A) Sequence logo representation of the 10-nt region surrounding the PARE MaxSeq in endogenous SMG6 targets and siGL2+siXRN1 pipeline controls. (B) Frequency of the 5-nt motif at each position in SMG6 targets and control transcripts. The red bar indicates where the motif would be expected to start in SMG6 targets, 2 nt upstream from the cleavage site. (C) Mismatch frequency at various positions within PARE sites that conform to the SMG6 motif at all but one position. (D) Frequency of SMG6 targets and pipeline controls whose MaxSeq is surrounded by a pentamer that matches the SMG6 motif at 0–4 of the defined positions, versus the frequency that such matches would occur by chance.