
Figure 7.
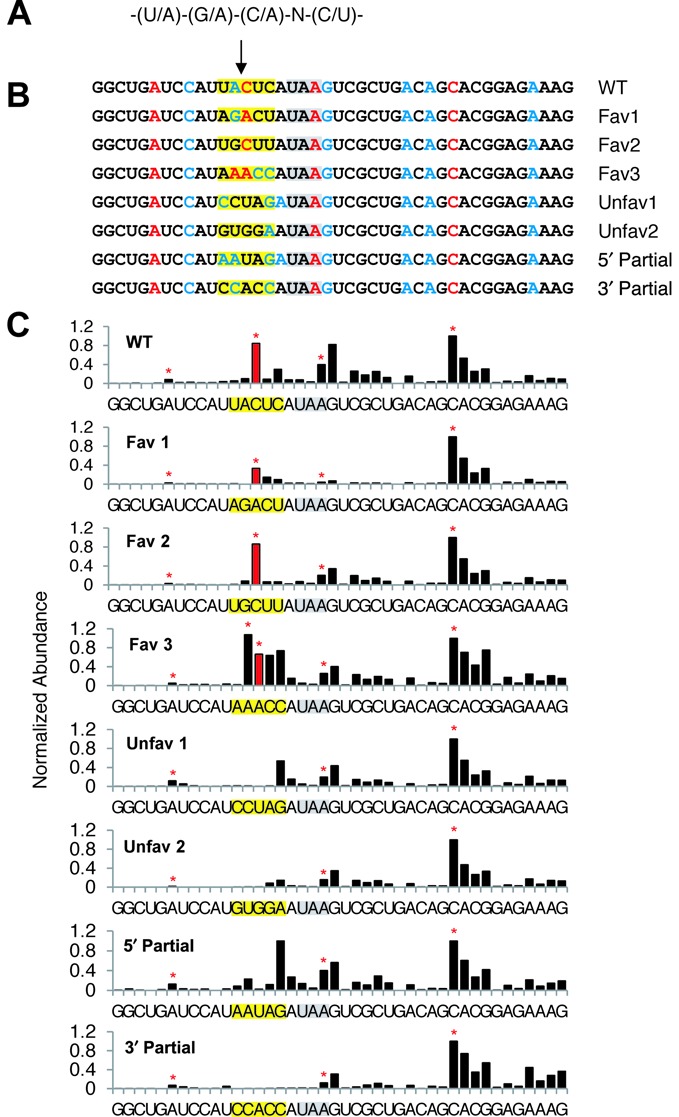
SPARE analysis of the pentameric motif. (A) The degenerate sequence of the motif. (B) PTC-proximal sequences of the SPARE reporters. The SMG6 cleavage site under investigation is marked by an arrow. The PTC is highlighted in gray. The altered motif sequences are highlighted in yellow. Red or blue letters identify the 5′ end of the expected cleavage products for sequence pentamers that matched the motif at every position (at 4 out of 5 positions). (C) SPARE D-plots. The bar heights in each D-plot were normalized to that of the abundant 5′ end 12 nucleotides downstream of the PTC. The red bar identifies the 5′ end resulting from cleavage at the PARE MaxSeq for the original TCRβ68 reporter. Red stars indicate the expected 5′-end generated by cleavage in pentamers that matched the motif at every position.