
Figure 8.
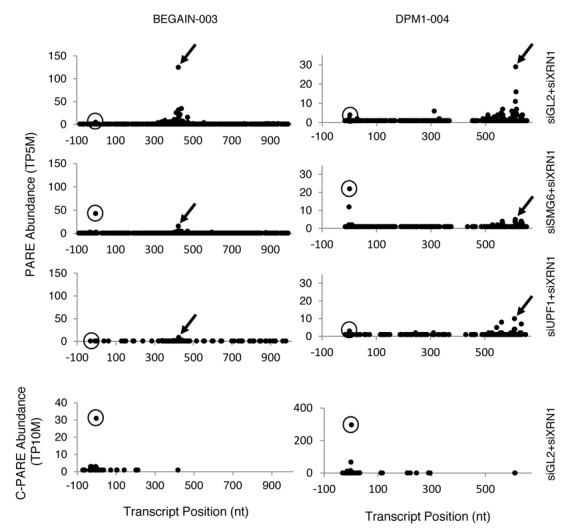
Accumulation of decapped transcripts when SMG6 but not UPF1 is depleted. Arrows in the D-plots of representative transcripts (BEGAIN-003 and DPM1–004) in Biorep 1 identify 3′ cleavage products whose accumulation is SMG6- and UPF1-dependent. Circles indicate the principal location of the 5′ cap, as determined by C-PARE (bottom panel). Similar effects were observed in Biorep 2.