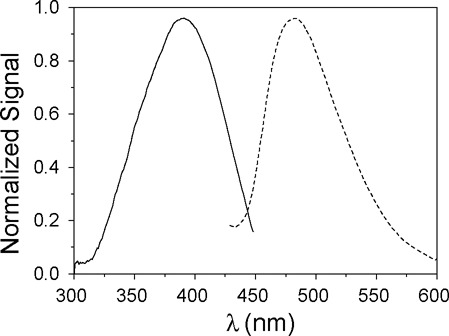
Figure 2.

Normalized excitation (—) and emission (- - -) fluorescence spectra of the trimolecular complex LER(Bim) (2 μM). The structure of the Bimane fluorophore is shown in Figure 1. Excitation spectrum with λem = 480 nm and emission spectrum with λexc = 398 nm; pH 7.5; 15°C.
