
Figure 7.
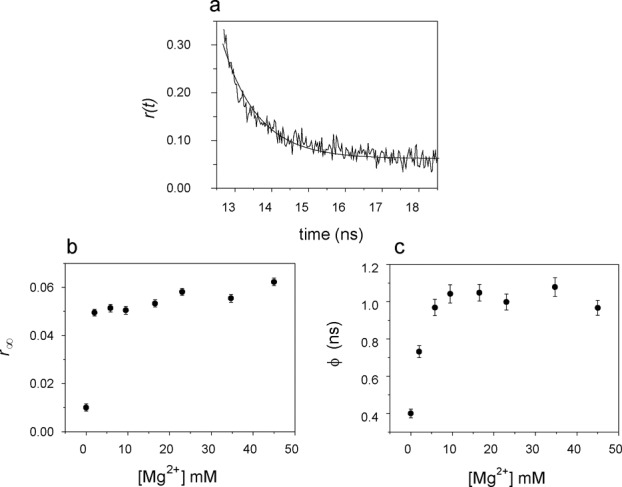
Time dependent anisotropy of Bim: dependence on the concentration of Mg2+. (a) Anisotropy decay of Bim in the L(dAp)ER(Bim) trimolecular complex at 45 mM MgCl2, decay curve analyzed with Equation (5); (b) residual anisotropy  ; (c) rotational correlation time ϕ. Conditions: 4.2 μM L(dAp), 4.1 μM E, 4.0 μM R(Bim), pH 7.5; 15°C; λexc = 405 nm, λem = 480 nm.