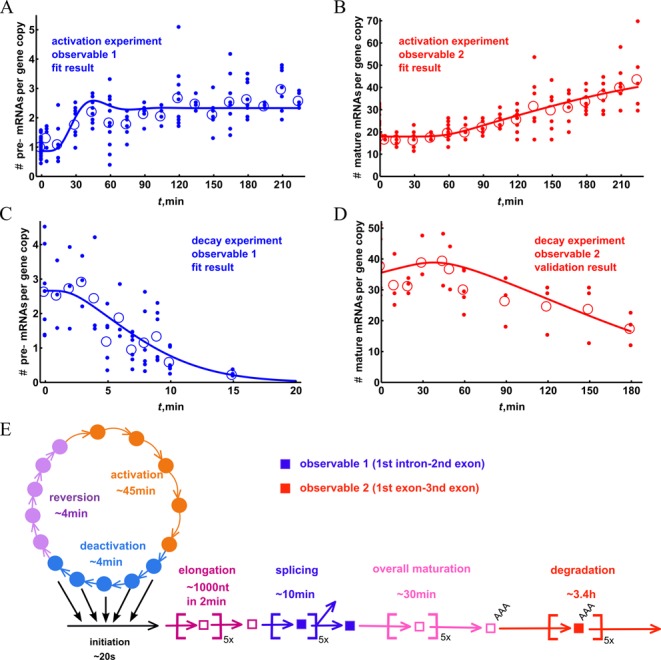
Figure 2.

Overview of the experimental data and performance of the mathematical model. For an improved comparison of experimental data and modeling results, the qPCR results for the RNA species were converted to copy numbers per cell. The induction of ADRP pre-mRNA (A) and mature RNA (B) in response to PPARδ ligand treatment are based on the data shown in Figure 1C and D. For comparison, the transcript decay dynamics of ADRP pre-mRNA (C) and mature RNA (D) is displayed. In this experimental series HepG2 cells were first stimulated for 3 h with PPARδ ligand and then treated for indicated time points with the RNA polymerase elongation inhibitor DRB. For each time point the small filled dots indicate individual data points and the circles represent their average. The lines visualize the performance of the fitted model. The curves shown represent the mathematical model in its n = 5 version (see Table 1 and Supplemental Material), which was fitted with the data sets A–C and validated with the data for the decay of mature mRNA (D). All the individual data points are reported in Supplementary Tables S3–S5. Please note that the copy numbers of the pre-mRNA decay data (D) were multiplied by 0.4, in order to reconcile the difference with ligand induction experiments (see Supplemental Material Data: conversion error section). The overview of the timescales of different processes in mRNA metabolism that were determined by using parameter estimation procedure is shown in (E).
