
Figure 1.
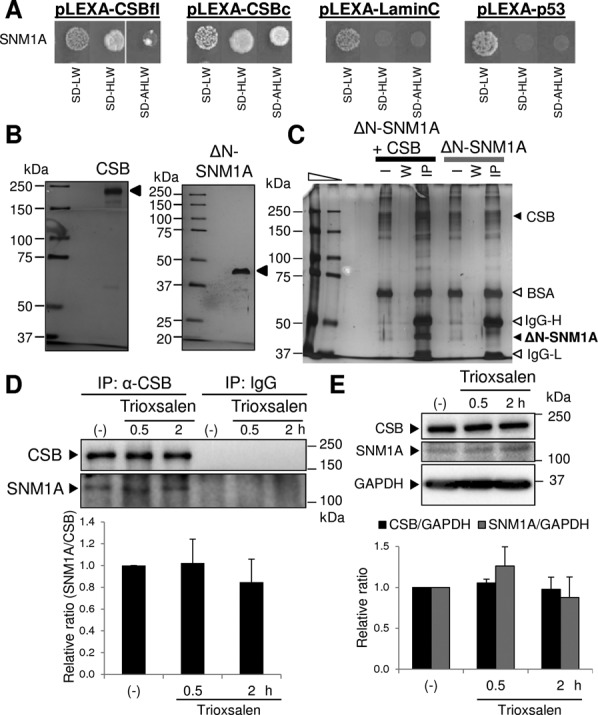
CSB and SNM1A interact. (A) Yeast two-hybrid interaction. The SNM1A-GAL4(AD) construct was cotransformed into NMY32 yeast with the indicated LexA(DBD) fusion construct (the pLEXA plasmids). The transformation mix was then spotted and allowed to grow on normal medium (SD-LW) or selection medium lacking histidine (SD-HLW) or histidine and adenine (SD-AHLW). Full-length CSB (CSBfl) and the 306 amino acid C-terminal CSB fragment (CSBc), as well as Lamin C and p53, were tested to determine interaction specificity. (B) Purified recombinant HA-tagged CSB and ΔN-SNM1A proteins. Purified recombinant HA-CSB (300 ng, left) and ΔN-SNM1A (300 ng, right) were loaded and separated on an 8% or 10% Tris–glycine–SDS-polyacrylamide gel, respectively. Proteins (designated by arrow) were then visualized using a Pierce Silver Stain Kit. Protein standards are indicated in kDa. (C) CSB physically interacts with the SNM1A nuclease fragment. ΔN-SNM1A (500 ng) was incubated with or without HA-CSB (500 ng) in the presence of α-HA magnetic beads. Bead-bound material was captured, washed and analyzed by silver staining after separation on an SDS-polyacrylamide gel. The positions of the CSB and SNM1A proteins are designated, as are the BSA, IgG-Heavy (H) and IgG-Light (L) bands intrinsic to the reaction mixture. I, 1/20th of the initial reaction mixture or input; W, material recovered from the third wash; IP, bead-bound, IP material. Protein standards are indicated in kDa. (D) Co-purification of endogenous CSB and SNM1A from human cell extracts. Whole cell extracts were prepared from HeLa cells, either without (-) or 0.5 or 2 h post-treatment with trioxsalen/UVA. Extracts were then incubated with α-CSB antibody or mouse IgG, and subsequently with protein A/G magnetic beads. Bead-bound IP material was captured, washed, extracted with SDS sampling buffer and subjected to western blot analysis. The positions of CSB and SNM1A are shown, as are the protein standards in kDa. Bar graph indicates the relative SNM1A:CSB ratio (average and standard deviation of three independent experiments), with the untreated (-) sample set as 1. (E) Expression of CSB and SNM1A is unchanged following trioxsalen/UVA treatment. Whole cell extracts were prepared from HeLa cells, either without (-) or 0.5 or 2 h post-treatment with trioxsalen/UVA. Extracts were immediately subjected to western blot analysis for CSB, SNM1A or GAPDH, as designated. Bar graph reports the relative expression for CSB/GAPDH or SNM1A/GAPDH, as determined from three independent experiments.