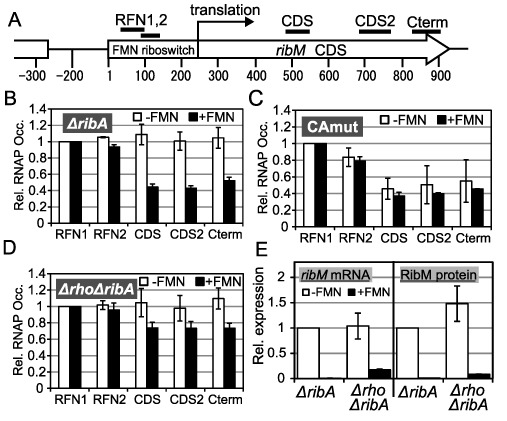
Figure 3.

Involvement of premature transcription termination in the FMN riboswitch function. (A) Schematic of targets of ChIP-qPCR analysis. A chromosomal region around the ribM gene is represented. Regions coding the FMN riboswitch and ribM CDS are indicated as a box and an arrow, respectively. Numbers indicate the distance from the transcription start point of ribM, which is designated as ‘1’. Bars above the diagram are targets of ChIP-qPCR (RFN1; 26–107 nt, RFN2; 69–131 nt, CDS; 492–548 nt, CDS2; 692–790 nt, Cterm; 832–911 nt) (B–D) ChIP-qPCR analysis. Relative RNAP occupancies (Rel. RNAP Occ.) at each target region (horizontal axis) in −FMN (white bars) and +FMN (black bars) cells of the ΔribA rpoC-FLAG (TK13) (B), ΔribA CAmut rpoC-FLAG (TK14) (C) and Δrho ΔribA rpoC-FLAG (TK15) (D) strains. The values shown are means from at least three experiments and standard deviations. (E) Relative expression levels of ribM mRNA (left) and RibM protein (right) in −FMN cells (white bars) and +FMN cells (black bars) of the ΔribA ribM-FLAG (TK05) and Δrho ΔribA ribM-FLAG (TK17) strains. The strains are indicated along the horizontal axis (ΔribA, TK05; and Δrho ΔribA, TK17). The values shown are means from at least three experiments standard deviations.
