Figure 2.

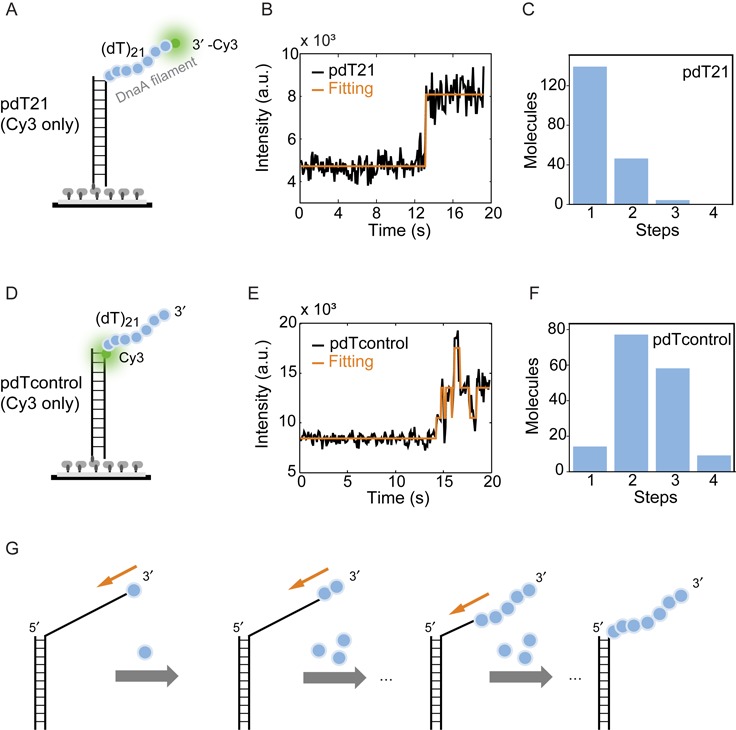
DnaA assembles in 3′ to 5′ directionality. (A) Schematic representation of the partial duplex DNA substrate used in smPIFE experiment with Cy3 labeled at the 3′ end of ssDNA tail. (B) A representative time trace of pdT21 substrate with a single-step enhancement in Cy3 intensity (black) after adding 5-μM DnaA and 1-mM ADP·BeF3. The transition is identified by eHaMMy (orange). (C) Number of steps identified for the pdT21-PIFE experiment. The majority of traces exhibited a one state behavior. (D) The partial duplex DNA substrate used in smPIFE as pdTcontrol with Cy3 labeled at the 5′ end of the ssDNA. (E) A representative time trace of pdTcontrol (Cy3 only) substrate shows multi-steps enhancement in Cy3 intensity (black) after adding 5-μM DnaA and 1-mM ADP·BeF3. The states are identified by eHaMMy (orange). (F) The histogram for pdTcontrol (Cy3 only) shows the majority number of steps from the initial intensity state to the highest intensity state is 2.4. (G) Schematic model of DnaA assembly in a 3′ to 5′ directionality.
