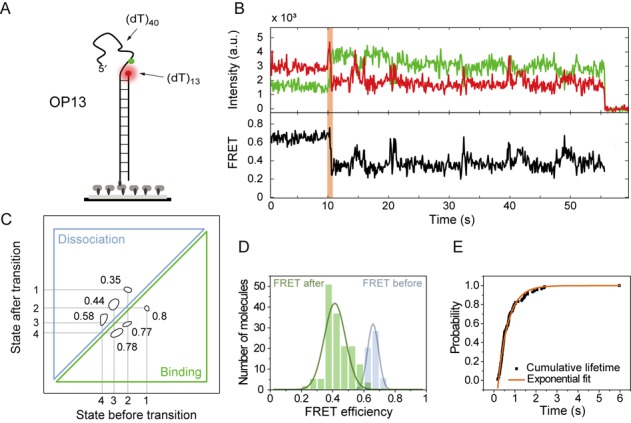
Figure 4.

DnaA filament nucleation is comprised of two to three monomers. (A) Schematic representation of the OP13 substrate with opposite polarity to HR13. (B) A representative time trace of the flow experiment for OP13 in the presence of 5-μM DnaA and 1-mM ADP·BeF3. The initial FRET efficiency drop and, by extension, the initial DnaA binding is highlighted in orange. (C) The TDP for OP13 (n = 168) shows four different states with the FRET values of 0.6, 0.51, 0.43 and 0.33. The majority of transitions occur in the low FRET efficiency region with the rates indicated. (D) The FRET histograms show a EFRET = 0.67 before DnaA binding (blue) and EFRET = 0.42 after DnaA binding (green). (E) Cumulative distribution of the transition time (black squares, n = 90 molecules). The data are well described with a single exponential function and the characteristic transition time is determined as 0.48 ± 0.01 s (orange line).
