Figure 5.

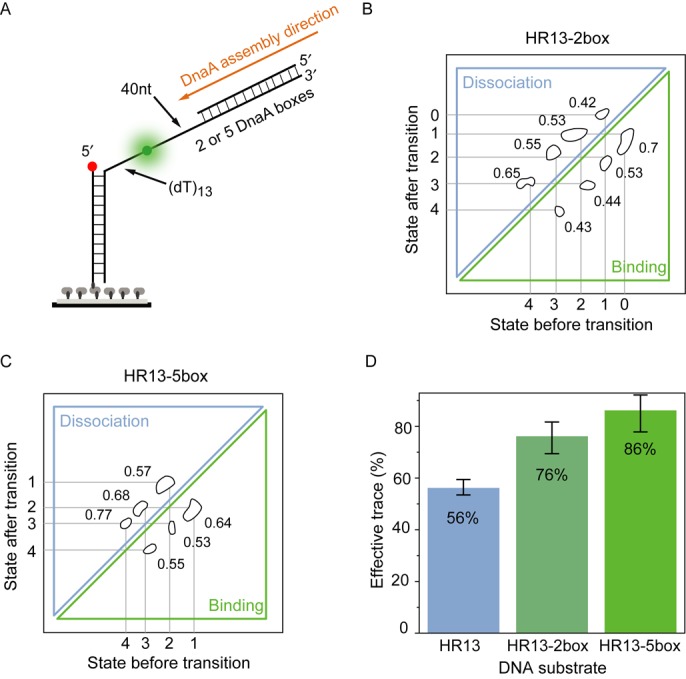
DnaA boxes enhance DnaA filament formation. (A) High-resolution HR13 substrate with two (HR13–2box) or five (HR13–5box) dsDNA DnaA binding boxes at the 3′ end of the ssDNA tail. (B) The TDP for HR13–2box shows five FRET different states with the FRET values of 0.75, 0.67, 0.57, 0.45 and 0.34 in the presence of 1-mM ADP·BeF3 and 5-μM DnaA. Compared to HR13, a lower FRET efficiency state is found. The transition rates per second are denoted besides the transition islands. (C) The TDP for HR13–5box shows four different states with the FRET values of 0.61, 0.52, 0.46 and 0.36. Compared to HR13–2box, the highest FRET state is missing. The transition rates per second of each transition are shown in the plot. (D) The ratio of effective traces with FRET fluctuations for different DNA substrates in the presence of 5-μM DnaA and 1-mM ADP·BeF3. Error bars represent the standard error. DnaA boxes increase the number of observed traces per field of view.
