
Figure 8.
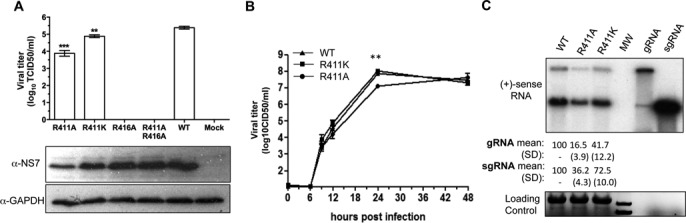
Mutations in the MNV RdRp that contacted the subgenomic promoter affect RNA synthesis during MNV infection. (A) Cell culture infectious dose for four viral constructs that have substitutions in the subgenomic promoter contact site. The bar graph summarizes the TCID50 for the mutant and WT viral constructs produced by BHK cells and titered in BV-2 cells. One Way ANOVA was used for significance testing, followed by a Dunnett post-test to compare all mutants to the WT. ***P < 0.001, **P < 0.01, n = 3. The lower two images are from western blots detecting the accumulation of the MNV RdRp, NS7 and the loading control, GAPDH. Note that mutant virus R416A and R411AR416A can express NS7, but that no viral progeny was produced. (B) Kinetics of viral progeny formation by the WT and mutant MNV. BV-2 cells were infected at a MOI of 1.0. The number of virion produced was determined by a limited dilution infection assay. The two asterisks (**) denote a P value of <0.01. (C) Accumulation of the genomic and subgenomic RNAs by the MNV mutants R411A and R411K in BV-2 cells. The upper image is from a northern blot of the total RNAs extracted 9 h after infection of BV-2 cells with mutant and the WT MNV at a MOI of 3. The lane labeled ‘MW’ contains a molecular weight ladder. Transcripts of the genomic RNA and sgRNA (the right-most two lanes) serve as molecular mass controls. The quantification of the genomic and sgRNAs are from three independent samples of the WT, R411A and R411K mutant viruses at 9 h after infection. The bottom image is of the ethidium bromide-stained denaturing agarose gel used for the northern blot. The bands are ribosomal RNAs and the MW standard. Transcripts of the gRNA and sgRNA are not present at an abundance to be detectable by ethidium bromide staining.