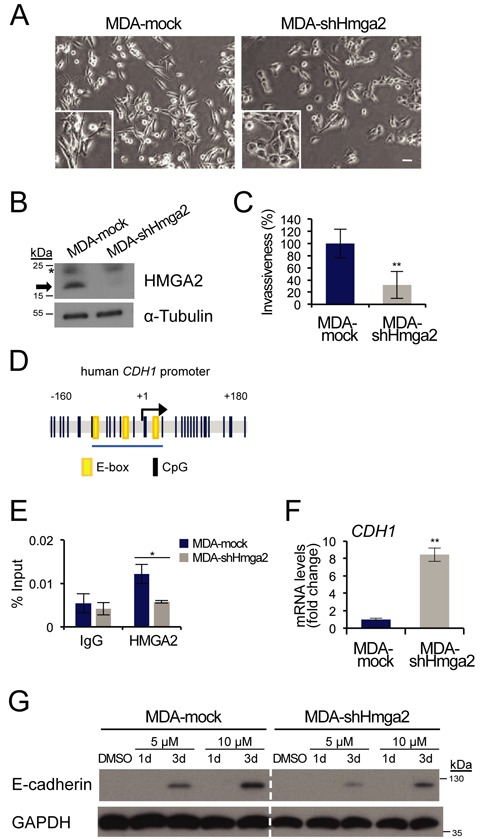
Figure 3.

Depletion of HMGA2 leads to increase of E-cadherin and reduced invasion. (A) Cellular morphology of MDA-MB-231 stable clones with HMGA2 knocked down (MDA-shHmga2) or empty pRetroSuper vector (MDA-mock). Scale bar: 50 μm. (B) Immunoblot analysis of endogenous HMGA2 in MDA-mock and MDA-shHmga2 cells (arrow) and α-tubulin serves as loading control. Asterisk indicates unspecific bands. (C) Invasion ability of MDA-mock and MDA-shHmga2 cells was assessed using a Matrigel transwell assay. Bar graph shows invasion rate relative to MDA-mock cells, which was set at 100% (mean ± SD values from triplicates). (D) An illustration of the human Cdh1 promoter, position −160 to +180 base pairs relative to the transcription start site (+1), containing E-boxes (yellow) and CpG dinucleotides (black lines). The blue underline indicates the proximal region (position −73 to +26) examined in ChIP-qPCR assays. (E) Human CDH1 promoter binding by endogenous HMGA2 was analysed by ChIP-qPCR in MDA-mock and MDA-shHmga2 cells. (F) E-cadherin (CDH1) mRNA analysis in MDA-mock and MDA-shHmga2 cells, normalized to GAPDH mRNA expression. Each bar represents mean ± SD values from triplicate samples and CDH1 levels in MDA-mock cell are normalized to 1. (G) MDA-mock and MDA-shHmga2 cells treated with vehicle or the indicated concentrations of 5-aza for 1 or 3 days, and immunoblotted for E-cadherin and GAPDH (loading control).
