
Figure 3.
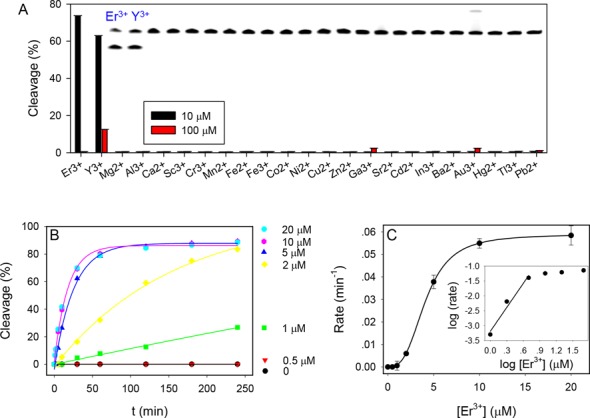
(A) Fraction of substrate cleavage by the Tm7 DNAzyme using 10 or 100 μM metal ions. Inset: gel image of cleavage in the presence of 10 μM metal ions. The lanes correspond to the metal ions in the x-axis. Only Au3+ produced streaking and Er3+ and Y3+ produced cleavage. (B) Kinetics of Tm7 cleavage at a few Er3+ concentrations. (C) Cleavage rate as a function of Er3+ concentration. Inset: the same data plotted using the log scale.