
Figure 4.
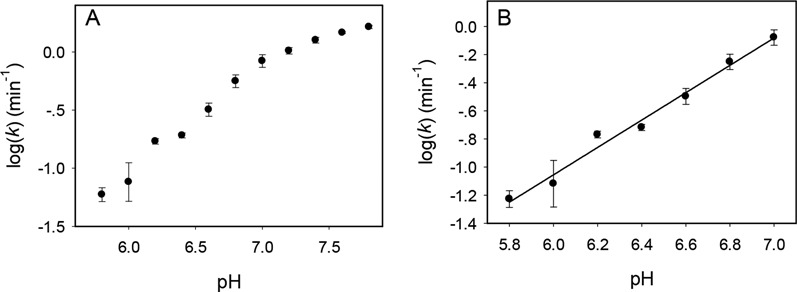
The pH-rate profile of the Tm7 DNAzyme over (A) a wide pH range and (B) the initial linear range. A slope of 0.97 is obtained in (B), indicating a single deprotonation step.
Official websites use .gov
A
.gov website belongs to an official
government organization in the United States.
Secure .gov websites use HTTPS
A lock (
) or https:// means you've safely
connected to the .gov website. Share sensitive
information only on official, secure websites.
The pH-rate profile of the Tm7 DNAzyme over (A) a wide pH range and (B) the initial linear range. A slope of 0.97 is obtained in (B), indicating a single deprotonation step.