
Figure 5.
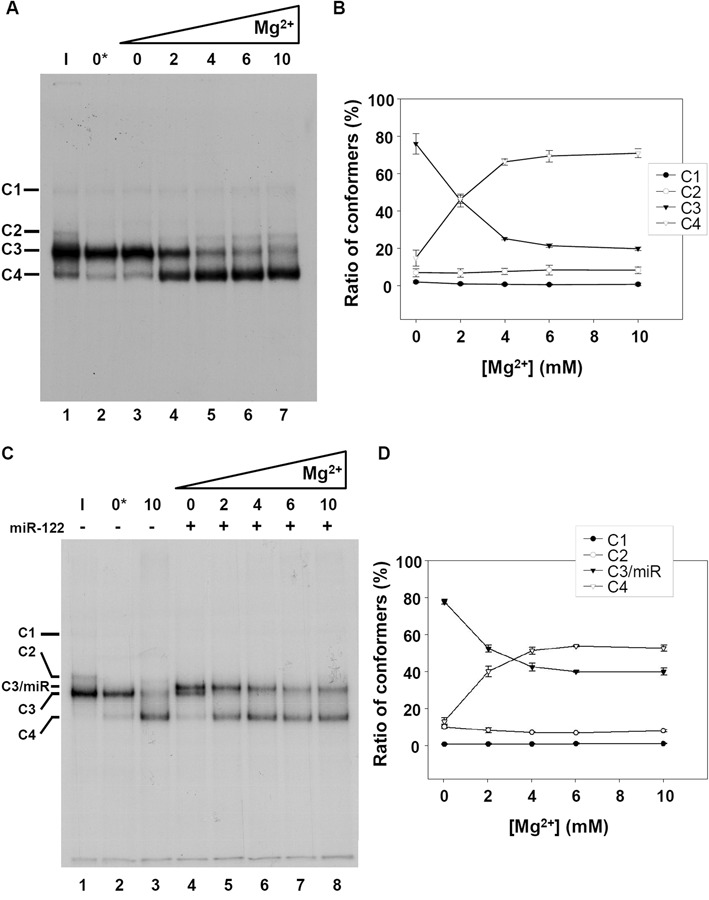
Native gel electrophoresis of the HCV IRES-574 at different Mg2+ concentrations. (A) Autoradiography of a non-denaturing 6% polyacrylamide gel. Internally labeled IRES-574 RNA was resuspended at 3 nM in each of the following conditions: in water and kept on ice for 10 min, as a control of intact RNA (sample ‘I’, lane 1); in standard folding buffer supplemented with 2 mM EDTA (sample ‘0*’ mM Mg2+, lane 2); in folding buffer alone (sample ‘0′ mM Mg2+, lane 3); in folding buffer containing Mg2+ at a final concentration of 2, 4, 6 and 10 mM (lanes 4–7). Resuspended RNA in lanes 2–7 was pre-heated to 90ºC for 1 min and slowly cooled down to room temperature. Four conformers, labeled as C1 to C4, are detected at different ratios in all the lanes. (B) Quantification of the percentage of formation of each conformer at 0, 2, 4, 6 and 10 mM Mg2+ in three independent experiments analogous to that showed in panel A (lanes 3–7). Mean values and standard deviations are shown. (C) Same as panel A showing the effect of the interaction of miR-122 with IRES-574: ice-incubated control IRES-574 RNA (sample ‘I’, lane 1); IRES-574 alone in buffer supplemented with EDTA (sample ‘0*’ mM Mg2+, lane 2); IRES-574 in folding buffer containing Mg2+ at 10 mM concentration (lane 3); IRES-574 (at 3 nM concentration) incubated with miR-122 (at 15 nM concentration) in folding buffer either lacking Mg2+ (lane 4) or in the presence of increasing concentrations of Mg2+ from 2 to 10 mM (lanes 5–8). Five conformers (labeled as C1, C2, C3/miR, C3 and C4) were observed in total. (D) Quantification of the percentage of formation of conformers C1, C2, C3/miR and C4 at 0–10 mM Mg2+ in three independent experiments analogous to that showed in panel C (lanes 4–8). Mean values and standard deviations are shown.