
Figure 6.
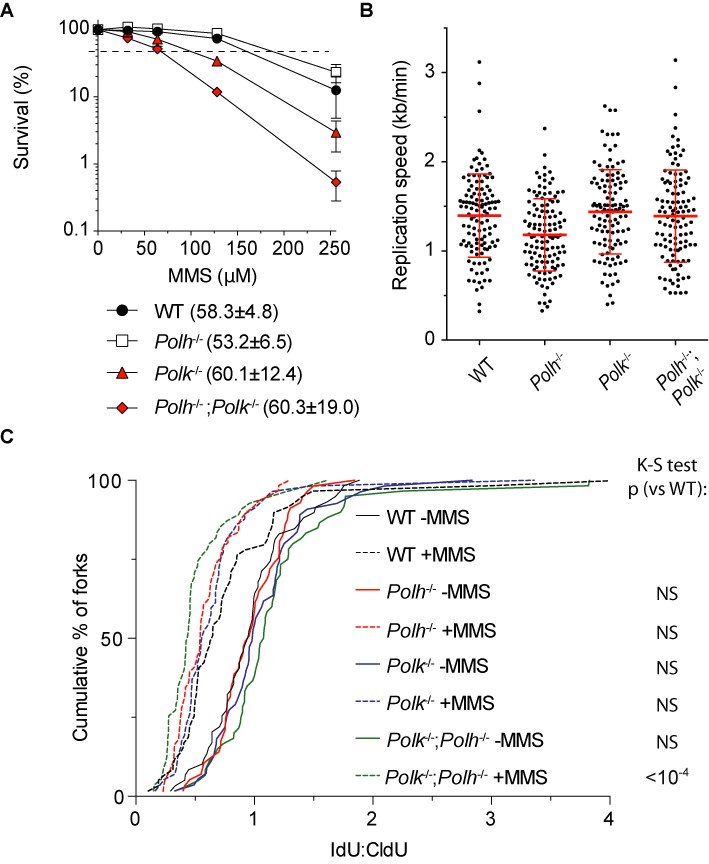
Colony survival and replication fork analysis of Polh−/−; Polk−/− MEFs. (A) Colony survival after MMS treatment of SV40 immortalized WT, Polh−/−, Polk−/− and Polh−/−; Polk−/- cells. Colony survival was normalized to the mock-treated cells for each condition and corrected for plating efficiency. Average of at least four independent experiments is plotted ±SD. The dashed line indicates 50% survival. Values behind the genotype description indicate average plating efficiencies ±SD. (B) Replication speed on non-damaged CldU track of SV40 immortalized WT, Polh−/−, Polk−/− and Polh−/−; Polk−/- cells. Average of at least 50 analyzed DNA fibers is shown ±SD. (C) Replication fork stalling analysis as in Figure 3C of SV40 immortalized WT, Polh−/−, Polk−/− and Polh−/−; Polk−/- cells. Data are presented as cumulative percentage of forks at each ratio. At least 50 DNA fibers were analyzed per experiment. The Kolmogorov–Smirnov (K-S) test was performed to determine statistical significance. NS means not significant. Only MMS-treated Polh−/−; Polk−/− cells show a significant difference (K-S test, p < 10−4) compared to MMS-treated wild-type cells. A representative experiment (of 2) is shown.