
Figure 4.
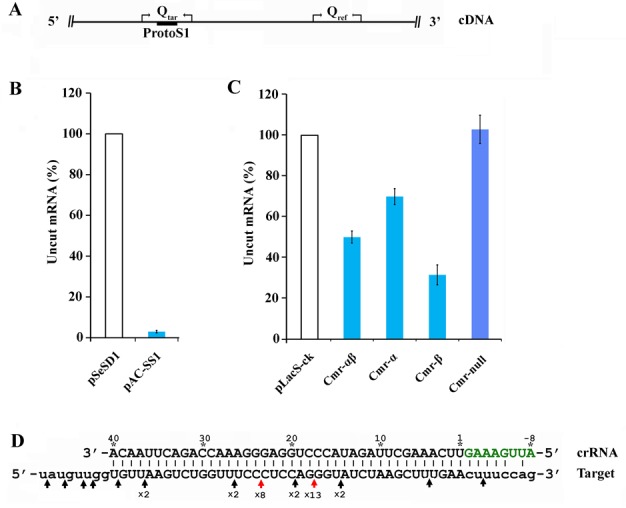
Target RNA cleavage analysis by real-time qPCR and 3′-RACE. (A) Strategy for detecting RNA cleavage at the S1 protospacer in mRNA. Qtar primer set amplified a region containing the predicted RNA cleavage sites while Qref amplified a region positioned upstream the S1 protospacer in mRNA. (B) Quantification of mRNA cleavage in RNA targeting strains of S. islandicus E233 carrying the chromosomal target gene lacS. Total RNAs were prepared from S. islandicus E233 cells harbouring pAC-SS1 or pSeSD1 and used for real-time qPCR. The amount of uncut mRNA is expressed as a ratio of lacS mRNA levels in transformants of pSeSD1 versus pAC-SS1. Bars represent the standard deviations of triplicates. (C) Quantification of mRNA cleavage in RNA targeting strains derived from S. islandicus E233S1 carrying the plasmid-borne lacS. Strains used are the same as in Figure 3B. Uncut mRNA is calculated as the percentage of the mRNA level in each strain carrying pAC-SS1 and that in S. islandicus E233S1 containing pLacS-ck. Bars represent the standard deviations of triplicates. (D) Schematic of cleavage sites within the S1 protospacer identified by 3′-RACE. Both protospacer S1 and the crRNA are shown with positions are numbered on crRNA. On RNA target: protospacer is shown as capital letters whereas the flanking nucleotides are in lowercase letters. The repeat handle of crRNA appears in green. Cleavage sites are indicated with arrows. Red arrows indicate cleavage sites by Cmr-α while Black arrows show cleavage sites by Cmr-β. Numbers below arrows indicate PCR clones carrying each cleavage site.