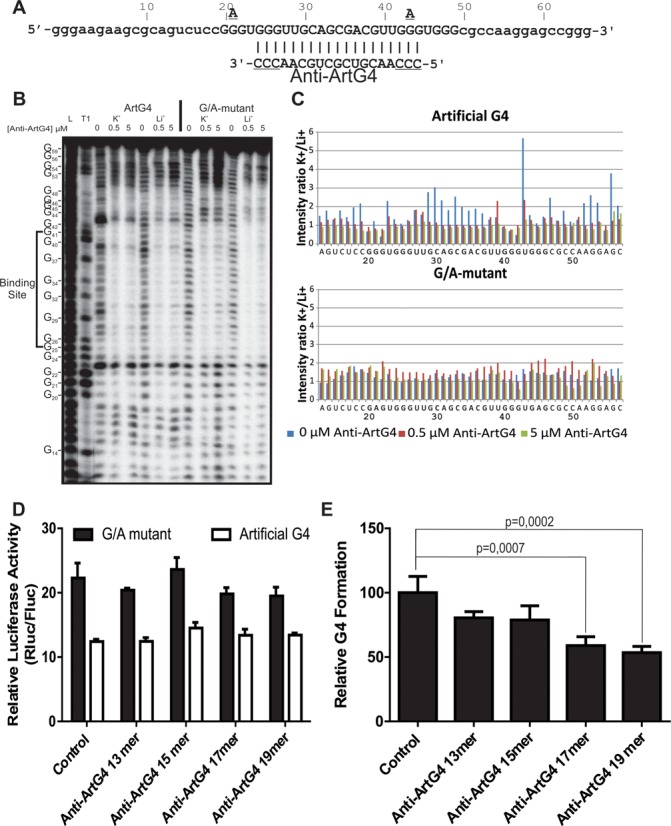
Figure 2.

Characterization of the long-loop-2 Artificial G4. (A) ArtG4 and Anti-G4 oligonucleotidesequences. G4 nucleotides appear capitals The guanines which were mutated for adenines in the ArtG4 G/A-mutant are shown directly above the ArtG4 residues. Nucleotide numbering is shown directly above the ArtG4 sequence. The Anti-G4 oligonucleotide sequence is located directly beneath the complementary ArtG4 nucleotide stretch; the underlined nucleotides denote those present in the 19-mer but not the shorter ASO. (B) Typical autoradiogram of in-line probing of the ArtG4 and G/A-mutant performed in the presence of either 100 mM KCl or LiCl and at three different concentrations of Anti-ArtG4. The two leftmost lanes, designated L and T1, correspond to alkaline hydrolysis and ribonuclease T1 (RNase T1) mappings of ArtG4, respectively. Individual ArtG4 guanosine residues including those encompassed by the Anti-G4 binding site, are indicated along the left edge of the autoradiogram. (C) Histograms showing the intensity ratio K+/Li+, which is an accurate reflection of relative accessibility, for each nucleotide of the ArtG4 and G/A-mutant at three different concentrations of Anti-ArtG4. The average of two independent experiments is shown. (D) Luciferase activity of the ArtG4 and G/A-mutant, using different length Anti-artG4 ASO in HEK293. The y axis corresponds to Rluc/Fluc luciferase-activity ratio. (E) Relative levels of G4 formation obtained by comparing the ArtG4 and G/A-mutant ratios of luciferase activity obtained using different length Anti-ArtG4 ASO. The G/A mutant/ArtG4 ratio with the control ASO was set at 100, and a ratio equal to 1 was set at 0. Means and standard deviations (s.d.) were calculated from three independent experiments, each conducted in triplicate.
