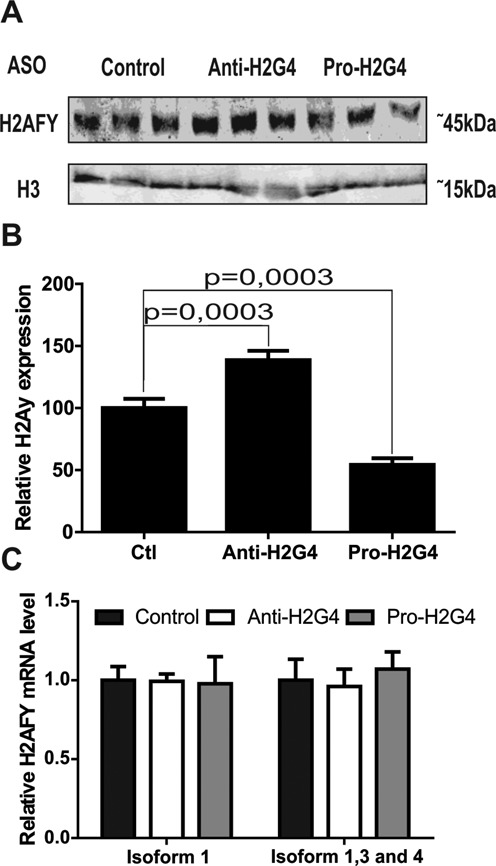
Figure 5.

Targeting endogenously expressed H2AFY. (A) Typical western blot analysis of Caco-2 cells for the H2AFY protein. Histone 3 (H3) was used as a loading control. Cells were transfected either with the Control, Anti-H2G4 or Pro-H2G4 ASO. (B) Quantification of the western blots. Means and SD were calculated from three independent experiments, each conducted in triplicate. (C) Relative endogenous mRNA levels for H2AFY isoform 1 (left panel) and isoforms 1, 3 and 4 taken together (right panel) in Caco-2 cells transfected with either the Control (green), Anti-H2G4 (Light green) or Pro-H2G4 (dark green) ASO. Means and SD were calculated from three independent experiments, each conducted in triplicate.
