
Figure 3.
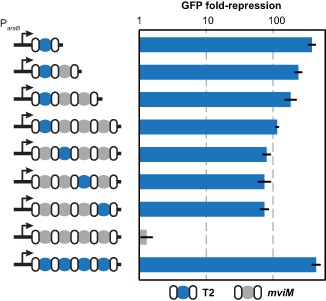
Impact of array length and spacer location on silencing efficiency. BW25113 Δcas3 cells harboring pUA66-lacZ and the indicated inducible CRISPR array plasmid were subjected to flow cytometry analysis following induction with IPTG and L-arabinose. Repression is calculated as the ratio of the autofluorescence-subtracted fluorescence for the inducible no-spacer plasmid (pcrRNA.ind) and each multi-spacer plasmid. Repeats, white ovals; T2 spacers, blue circles; non-targeting spacers matching the S. enterica mviM gene, gray circles. See Supplementary Figure S3B for representative histograms from the flow cytometry analysis. Values represent geometric mean and SEM from independent experiments staring with three separate colonies.