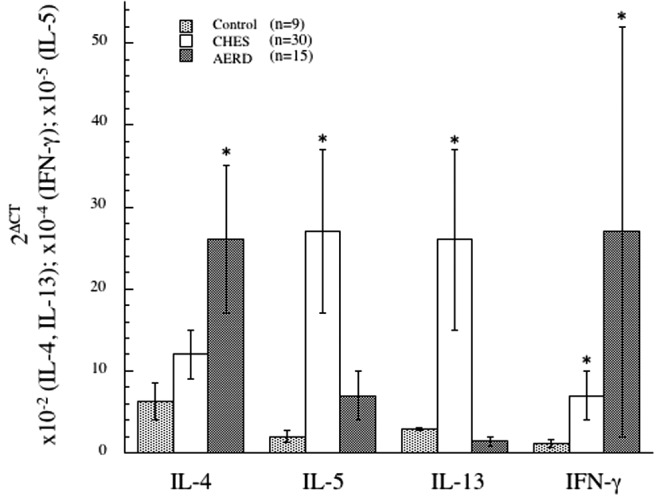
Figure 2.

Th1/Th2 cytokine signature in control, CHES, and AERD sinus tissue by qPCR. Tissue samples were homogenized after surgical removal and RNA isolated. Transcript levels for IL-4, IL-5, IL-13, and IFN-γ were quantified using PCR with SYBR-green detection. Data (mean ± SEM) reflect relative expression of each gene in comparison with β-actin (2ΔCT). Control samples (n = 9) are depicted in black bars, CHES (n = 30) in gray bars and AERD (n = 15) in white bars. *p < 0.05 as compared with control. Reprinted from Steinke et al.,52 with permission from Elsevier.
