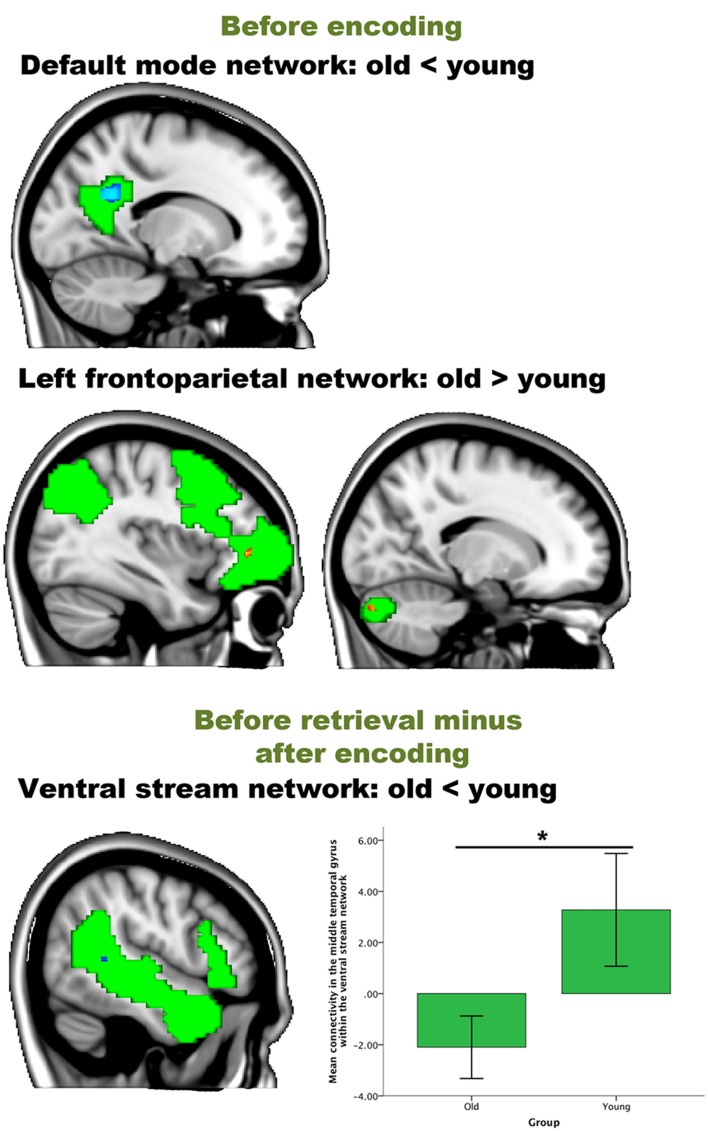
Figure 6.
Resting-state differences between older and young within the networks of interest. Within-network group differences were found for the contrasts “before encoding” and “before retrieval minus after encoding.” Blue clusters show decreased connectivity in older adults, red clusters indicate increased connectivity in older adults. The bar chart depicts the group differences between the lateral temporal cortex and the ventral stream (error bars indicate 1 standard error) *p-value < 0.05.

