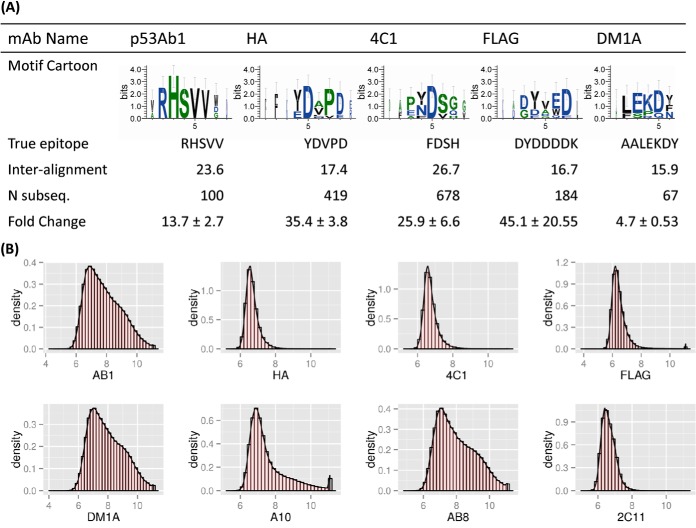
Fig. 2.
Monoclonal antibody motifs and their corresponding epitopes. A, the five motifs listed were revealed after we incubated monoclonal antibodies on the peptide microarrays and performed subsequence analysis. Sequence logos were created using the top 10 most highly ranked subsequences obtained from the peptide sequences. Weblogos suggested positional dependence with dominating anchor residues and linking or non-anchor regions. “True epitope” is the sequence determined by the manufacturer. “Inter-alignment” is the expected value of pairwise gapless alignment scores (BLOSUM62 matrix) between any two significant subsequences pulled from the arrays. “Fold change” indicates the relative binding strength of the peptides making up the motif versus the median binding intensity for that peptide in the other monoclonal antibodies tested. Antibodies for which consensus motifs could not be found were A10 (EEDFRV), p53Ab8 (SDLWKL), and 2C11 (NAHYYVFFEEQE). Additional information about these antibodies and their immunogens can be found in Table I. B, histograms of each monoclonal antibody tested. The x-axis is the log10 normalized signal intensity, and the y-axis is the data density. Antibodies demonstrated varied binding profiles, with monoclonals such as HA, 4C1, and FLAG showing a narrow distribution around low intensities, and others such as AB1 and DM1A demonstrating a broader binding profile. See Table II for an analysis of on-target versus off-target binding.

