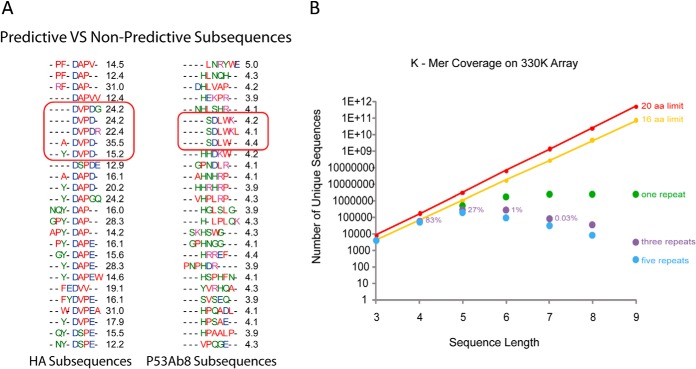
Fig. 3.
Sequence representation and predictive versus non-predictive subsequences. A, top 25 sequence motifs found for monoclonal antibodies HA (left) and p53 (right). Red outlined regions indicate the closest match to the actual epitope for the given monoclonal antibody. The black number is the average fold change of the peptides containing the indicated motif relative to the same peptides for all other monoclonal antibodies. Although small differences occurred, there is a consensus pattern. In contrast, p53Ab1 (right) demonstrated high overall binding to the true epitope but cross-reacted with many other sequence clusters, preventing good prediction and yielding low fold-change values. B, the fraction of all possible k-mers present on the array as a function of k-mer length. The arrays represent 27% of all possible 5-mers redundantly.

