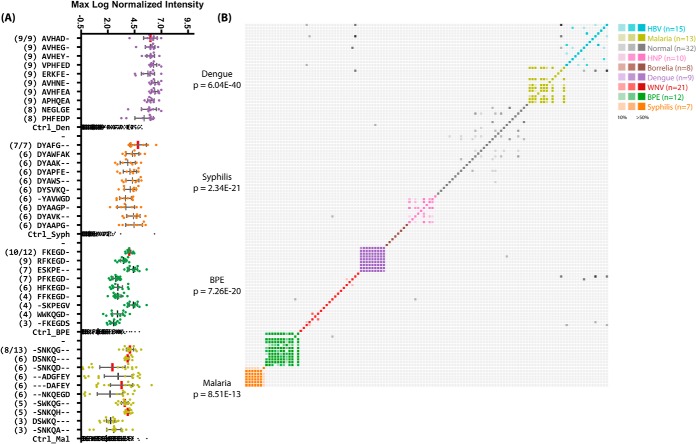
Fig. 4.
Top significant subsequences for disease cohorts. A, the top 10 most commonly appearing and significant subsequences in serum samples from the indicated disease cohorts. The number of patients within that cohort for which that sequence was called significant is shown in parentheses to the left. The y-axis is categorical and shows each subsequence; the x-axis is the maximum log10-normalized intensity of the peptide binding on the array for each patient. The total number of samples in each cohort is given as a fraction at the top. Subsequences with exact matches to proteins within the pathogen are indicated with vertical red bars. The top ranked sequences are listed in Table III. B, the pairwise fractional overlap in significant subsequences. A colored, saturated cell represents a pair of patients in the same cohort that shared at least 50% of their significant subsequences. Grayscale cells represent pairs of patients from different cohorts whose immune systems see similar sequences. Individuals within the same disease cohort showed much more overlap between their significant subsequences than those in different cohorts or the normal cohort, indicating an association between the discovered sequences and the disease state. BPE, Bordetella pertussis; HNP, Human Normal Pools, a collection of pools of non-disease individuals.

