Fig. 2.
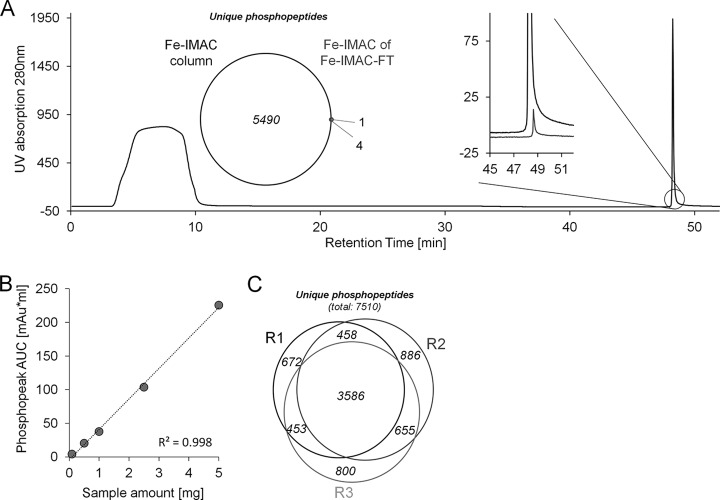
Fe-IMAC column characterization. A, Fe-IMAC UV chromatogram of 1 mg of A431 cell digest. The phosphopeptide fraction (reaction time: ∼49 min) is well separated from the column breakthrough that contains the non-phosphorylated peptides. The inset on the left shows the number of phosphopeptides identified from the IMAC eluate and the number of phosphopeptides identified from a second IMAC enrichment of the column flow-through (FT) of the first Fe-IMAC enrichment. The inset on the right shows the respective UV traces. Both indicate that the A431 digest was essentially depleted of phosphopeptides. B, UV signal-based quantification of Fe-IMAC enriched phosphopeptides as a function of the amount of cellular digest applied. It is apparent that the column captured phosphopeptides over a wide linear range. C, Venn diagram of the number of unique phosphopeptide identifications across three technical replicates of Fe-IMAC purification of phosphopeptides from 1 mg of A431 lysate digest.

