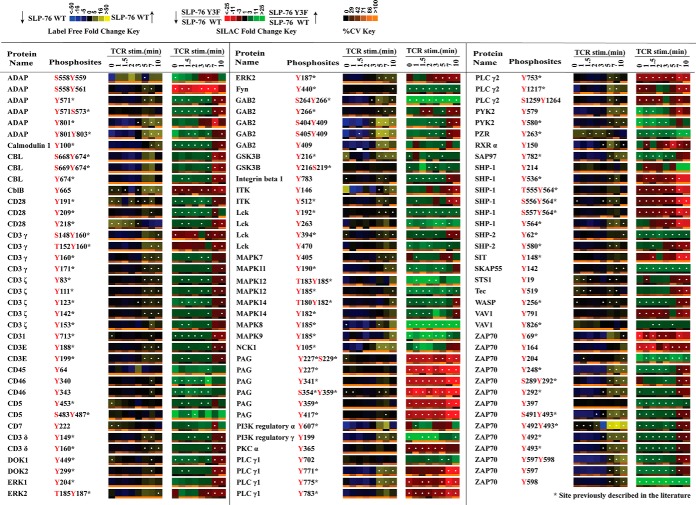
Fig. 1.
Quantitative phosphoproteomic analysis of known TCR signaling proteins. Listed is a portion of the data collected representing proteins annotated in KEGG as T-cell receptor signaling proteins. Heatmaps were calculated from five replicate experiments. The label-free heatmap represents the temporal change in the phosphorylation of proteins from wild-type SLP-76 reconstituted cells (J14–76-11) through a time course of TCR stimulation. In the label-free heatmaps, black squares represent a phosphopeptide abundance equal to the geometric mean for that phosphopeptide across all time points. Yellow represents levels of phosphorylation above the average, and blue corresponds to less than average abundance (as indicated in the color legend). Within the label-free heatmap, white dots indicate a statistically significant difference (Q value < 0.05) in the fold change in phosphopeptide abundance for that time point in the SLP-76 wild-type reconstituted cells. In the second SILAC heatmap, SILAC ratios between Y3F mutant cells (J14–2D1) and SLP-76 reconstituted cells (J14–76-11) are represented for each phosphopeptide at each time point according to the SILAC heatmap color key. Black signifies no change. Red represents reduced phosphorylation in Y3F mutant cells, and green represents elevated phosphorylation in Y3F mutant cells. White dots on SILAC heatmap squares indicate a statistically significant difference (q value < 0.05) in the comparison between Y3F mutant and SLP-76 reconstituted cell SILAC ratios for that time point. Below each heatmap time point is a separate heatmap representing the coefficient of variation (cv) for that time point. According to the cv color key, black represents 0% cv, and more orange shading represents a greater cv. Blanks in the heatmaps indicate that a clearly defined SIC peak was not observed for that phosphopeptide at that time point.

