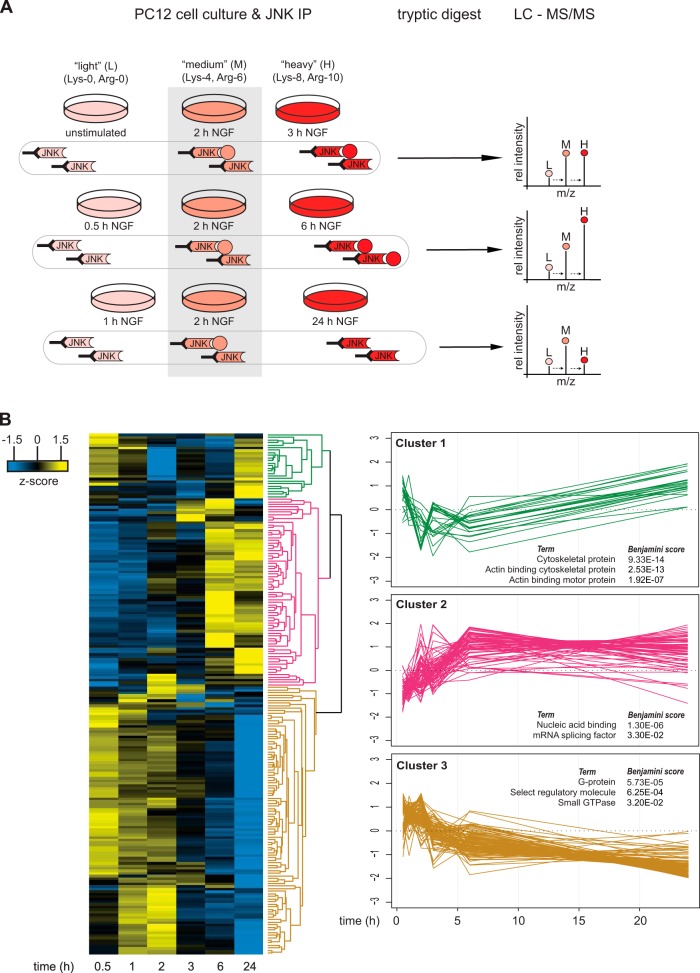
Fig. 2.
Quantitative mass spectrometry timecourse analysis of potential JNK interacting proteins after NGF treatment. A, PC12 cells were grown in light, medium, or heavy SILAC media and were stimulated with NGF for different lengths of time. After JNK immunoprecipitation, samples were combined, digested with LysC and trypsin, and analyzed via LC-MS/MS. NGF-induced changes in JNK protein binding were calculated by using medium (2-h NGF-treated) cells as an internal reference. The illustration shows an example for a protein that transiently binds to JNK with the highest affinity at 6 h after NGF treatment. B, data from two independent biological experiments were combined and analyzed with MaxQuant. Proteins with a log2 fold change ≥ 0.7 and/or log2 fold change ≤ −0.7 at any time point given were extracted and z-scored. Proteins with similar JNK binding kinetics were clustered using Perseus software (Euclidean distance, average linkage, n = 201). Analysis of the molecular function of potential JNK interacting proteins using Protein Analysis through Evolutionary Relationships (PANTHER) revealed an enrichment for cytoskeletal protein (cluster 1, n = 25), nucleic acid binding (cluster 2, n = 73) and G-proteins (cluster 3, n = 104). The three most significant PANTHER terms per cluster are shown.

