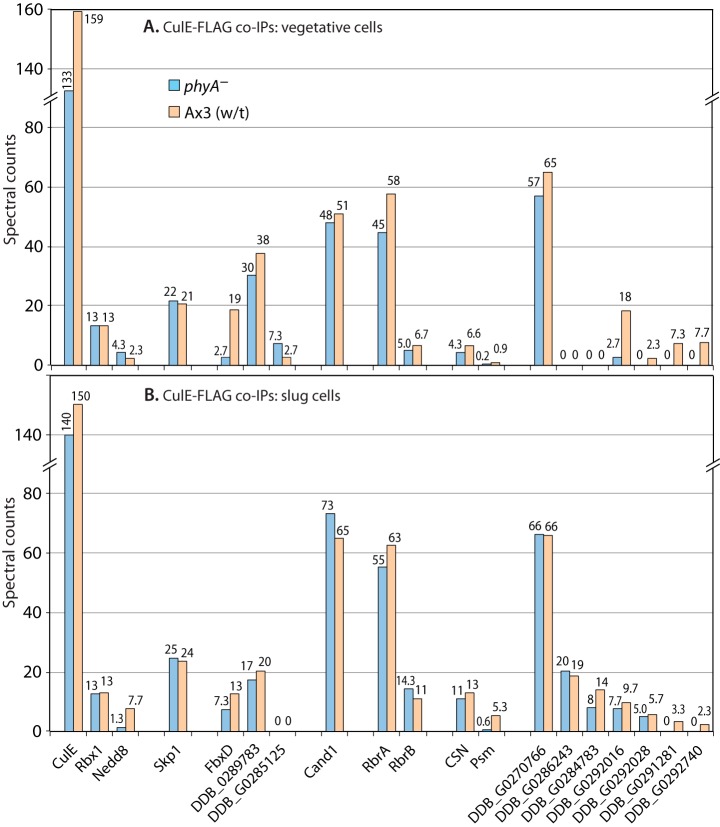
Fig. 4.
Proteomic analysis of CulE interactions. Vegetative (A) or slug-stage (B) wt or phyA– cells whose culE locus was FLAG-tagged were subjected to co-IP with anti-FLAG (mAb M2) beads, and potential interactors were identified based on mass spectrometric identification of tryptic peptides and exclusion criteria as described in “Experimental Procedures.” Average spectral counts of peptides detected for each protein in triplicate replicates of the single experiment for each panel are plotted in descending order (left to right) of total abundance in phyA– cells. For the protein complexes represented by CSN and PSM (proteasome), average values of detected polypeptides are reported; full data are in supplemental Fig. S1. Protein descriptors and RNA expression patterns are in supplemental Table S1. Full data are shown in supplemental Table S2.

