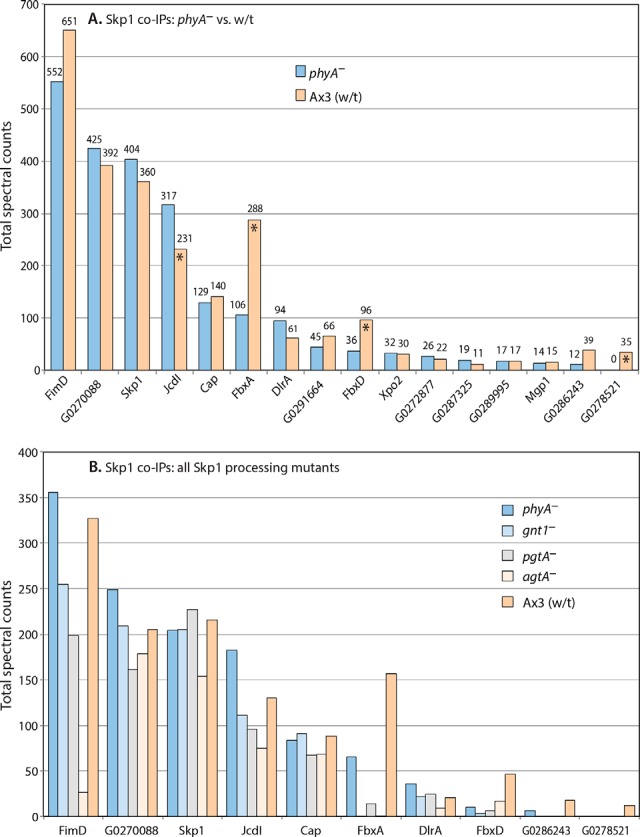
Fig. 5.

Proteomic analysis of Skp1 interactions. Slug-stage cells were subjected to co-IP with affinity-purified anti-Skp1 (UOK77)-coupled beads. Data from four co-IPs conducted under two conditions (pH 7.4 or pH 8.0; 0.2% or 1% Nonidet P-40), each conducted in triplicate, were pooled owing to the absence of systematic differences, and total spectral counts are reported. A, Ax3 and phyA– are compared. Asterisks denote those proteins for which the quantitative difference between wt and phyA– cells was observed in all trials in which the protein was detected. B, comparison of phyA–, gnt1–, pgtA–, and agtA– and wt (Ax3) cells. Protein descriptors and RNA expression patterns are in supplemental Table S1. Full data are shown in supplemental Table S3.
