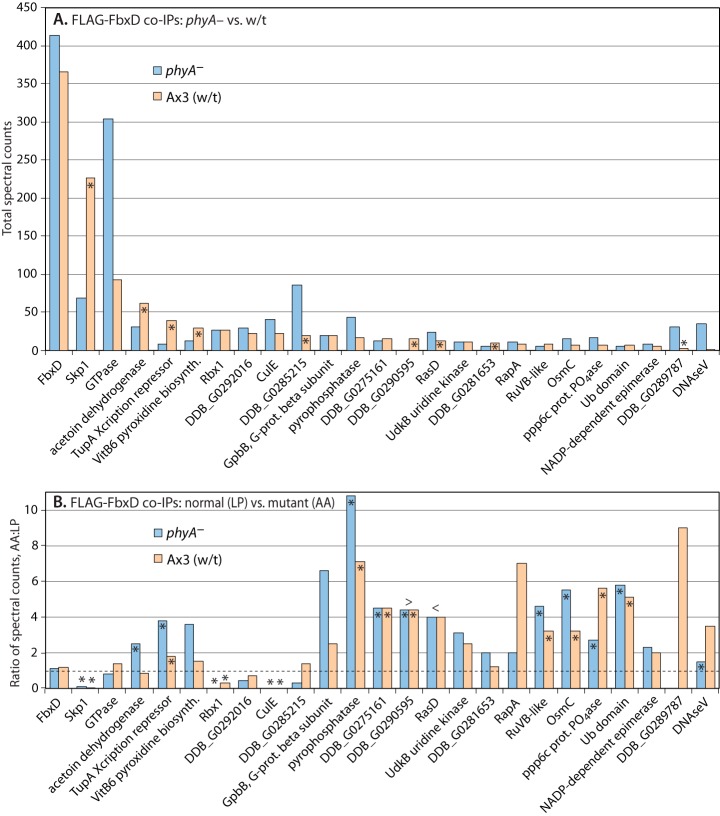
Fig. 6.
Proteomic analysis of FbxD interactions. Slugs expressing ectopic FLAG-FbxD or FLAG-FbxD(LP-AA), in the presence of endogenous FbxD, under control of the prespore cell-specific cotB promoter were harvested and subjected to co-IP with anti-FLAG (M2) beads as described in “Experimental Procedures.” Potential interactors were identified based on their presence in FLAG pulldowns, absence or near absence from control IPs conducted in non-FLAG-tagged strains, and other criteria as in Fig. 4. A, Ax3 and phyA– cells expressing FLAG-FbxD are compared. Data from three co-IPs conducted under two conditions (pH 7.4, 1% Nonidet P-40; pH 8.0, 0.2% Nonidet P-40), each conducted in triplicate, were pooled owing to a lack of systematic differences, and total spectral counts are plotted. Asterisks signify differences between wt (Ax3) and phyA– cells that were consistent in all trials. B, comparison of FLAG-FbxD and FLAG-FbxD(LP-AA) co-IPs from the two trials shown in A that included mutant FbxD. Ratio of total spectral counts (mutant:normal FbxD) are plotted. The dashed line indicates the ratio value corresponding to no change in cells expressing mutant versus normal FLAG-FbxD. Asterisks signify differences between mutant and normal FLAG-FbxD that were consistent in both trials. > or < refer to values that are greater than bar values immediately to the right or left, respectively (resulting from a denominator value of zero). Protein descriptors and RNA expression patterns are in supplemental Table S1. Full data are shown in supplemental Table S4.

