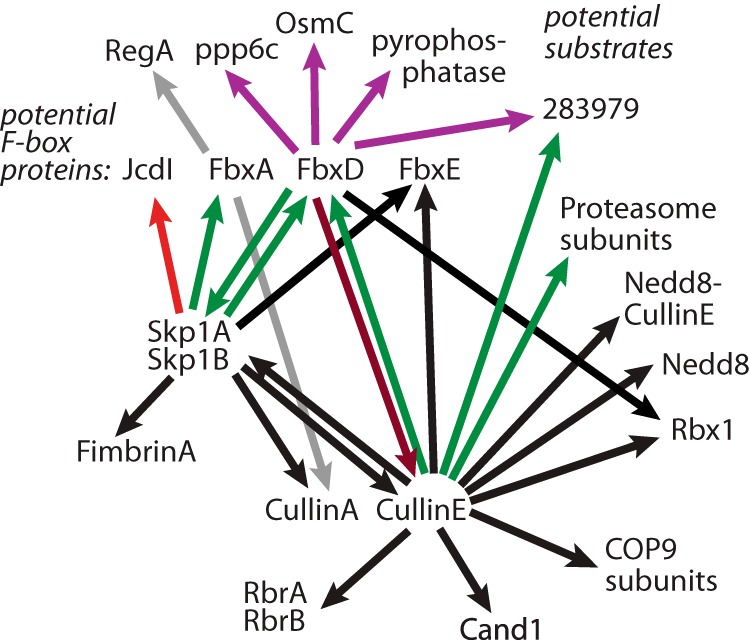
Fig. 9.

Summary of Skp1 interactome. Arrows depict interactions detected in the present or previous studies. The tail denotes the bait, and the tip the prey. Black indicates an interaction not affected by the modification status of Skp1. Green indicates an interaction that was greater in wt than in phyA– cells, and red denotes an interaction that was less. Gray indicates a previously described interaction (36) whose dependence on Skp1 modification has not been examined.
