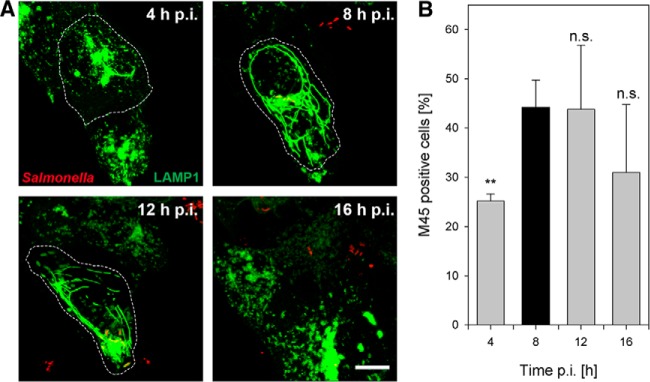
Fig. 3.

Extension of the SMM network (A) and the number of SseF-positive host cells (B) are maximal at 8 h p.i. A, HeLa cells expressing LAMP1-GFP (green) were infected with Salmonella HH107 expressing SseF-2TEV-2M45 and mCherry (red). Continuous live cell imaging was performed and representative images of Salmonella-infected cells at various time points p.i. show the extent and variation in SIF morphology. Images are shown as maximum intensity projections. Scale bar: 10 μm. B, infected cells were fixed at the indicated time points p.i., immunostained for SseF-2TEV-2M45, and analyzed via flow cytometry. The percentage of M45-positive cells at various time points p.i. is indicated. Shown are the mean values (+ S.D.) of three independent experiments. Student's t-test relative to 8 h p.i. values: **p < 0.01. n.s., not significant.
