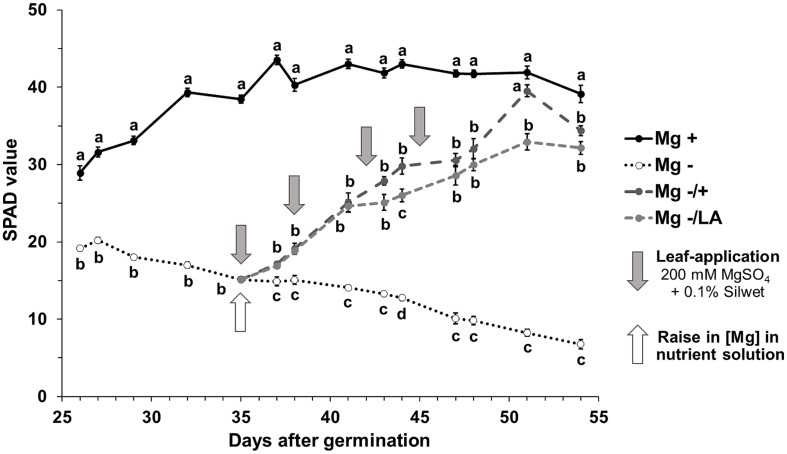
FIGURE 2.
Course of SPAD values of the sixth leaf over time. Relative chlorophyll concentration in the sixth leaf assessed by SPAD measurements. Mg+, 0.5 mM MgSO4 in NS; Mg-, 0.01 mM MgSO4 in NS; Mg–/+, 0.01 mM MgSO4 in NS for 5 weeks and 0.5 mM MgSO4 in NS for 3 weeks; Mg–/LA, 0.01 mM MgSO4 in NS and leaf-application of 200 mM MgSO4 for four times. Measurements were made on two plants of each of the four biological replicates per treatment; four individual SPAD values per leaf were averaged. Mean ± SE; arrows show date of leaf-application with 200 mM MgSO4; small letters indicate significant differences between treatments for an observation date (ANOVA with Bonferroni adjustment, p ≤ 0.05).

