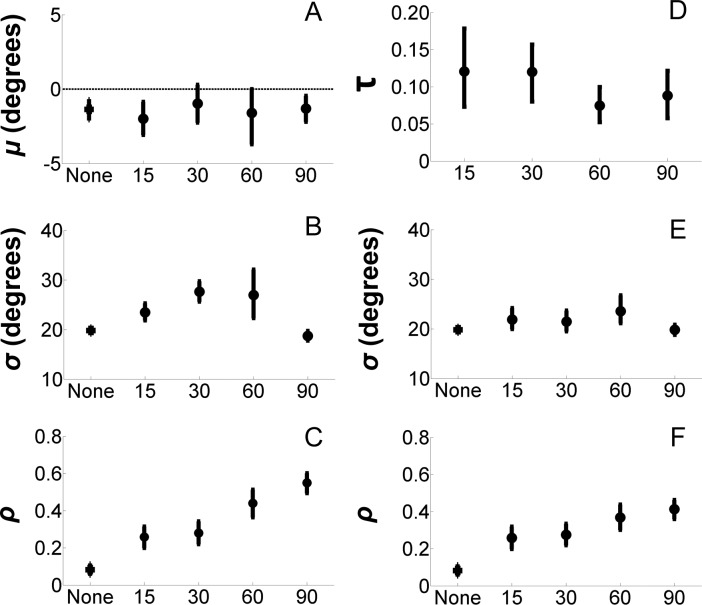
Figure 4.
Parameters of the best fitting pooling (left column) and substitution (right column) models. (A, B, and C) Estimates of μ, σ, and ρ estimated from the pooling model (Equation 1) as a function of distractor presence and target–distractor rotation differences (±15° through ±90°). (D, E, and F) Estimates of τ, σ, and ρ obtained from the substitution model in Equation 2 as a function of distractor presence and target–distractor differences. By definition, τ = 0 when there are no distractors in this display, so this condition has been omitted from (D). The estimate of σ for uncrowded trials in (E) was obtained via the pooling model, i.e., it is identical to the estimate shown in (C). Error bars are 95% confidence intervals.

