Fig. 4.
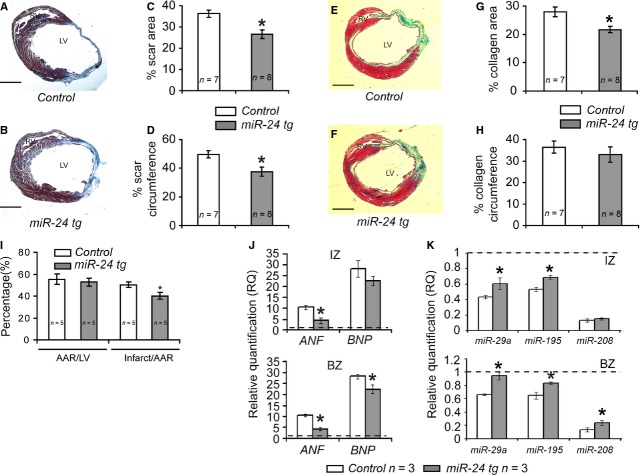
Myh6-miR-24 transgenic mice exhibit reduced scar size, lowered stress marker expression and partial restoration of dysregulated miRNAs. (A–D) Scar visualization by AZAN staining and scar size quantification on control (n = 7) and miR-24 tg (n = 8) hearts 4 weeks post-MI, with miR-24 tg mice showing reduced scar size. LV, left ventricle. (E–H) Alternative scar size visualization and quantification by Masson-Trichrome staining. Green = collagen; pink = cytoplasm; red = muscle fibres; black = nuclei. (I) Histogram showing size of area at risk (AAR) and size of infarct in control (n = 5) and miR-24 tg (n = 5) hearts 24 hrs after MI. miR-24 tg mice showed reduced infarct size. (J) Histograms showing relative expression levels of stress markers atrial natriuretic factor (ANF) and brain natriuretic peptide (BNP). miR-24 mice showed lowered levels of stress markers. IZ, infarct zone; BZ, boarder zone. (K) Histograms showing relative expression levels of microRNAs miR-29a, miR-195 and miR-208. miR-24 mice showed partial restoration of these miRNAs. *P < 0.05.

