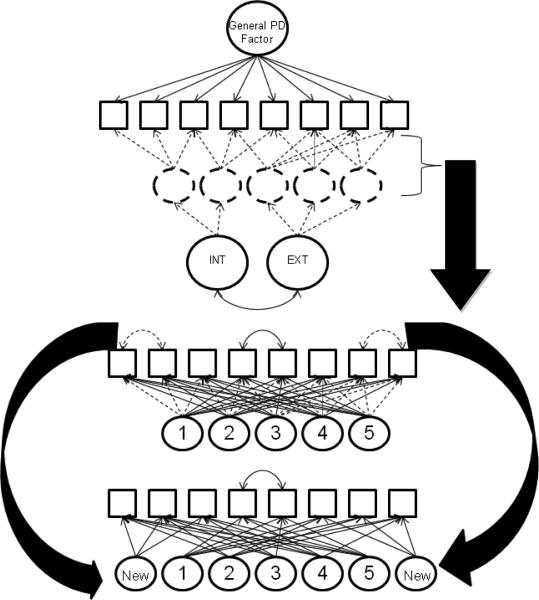
Figure 1.
The panels provide an overview of the process of developing the final bifactor model (shown in Figure 2). Circles denote latent variables and squares reflect observed indictors. Solid lines show aspects of the model that were determined a priori while dotted lines indicate that the nature of a given model component (i.e., the number of trait factors, the loadings) was determined through exploratory methods (shown in the middle panel), even though the general structure of the model was hypothesized a priori. The middle and bottom panels provide a simplified example of how the exploratory structural equation modeling (ESEM) was used (middle panel) to develop the trait portion of the bifactor model (bottom panel). The ESEM revealed several modification indices that suggested residual covariances that were not justifiable as simple method effects (shown by the dotted, curved, double headed arrows in the middle panel) and one modification index that reflected a true method effect. In the bifactor model that was specified subsequently, the residual covariances not due to method effects were specified as new factors in the model and non-significant factor loadings (indicated by dotted loadings in the middle panel) were eliminated, as shown in the bottom panel.

