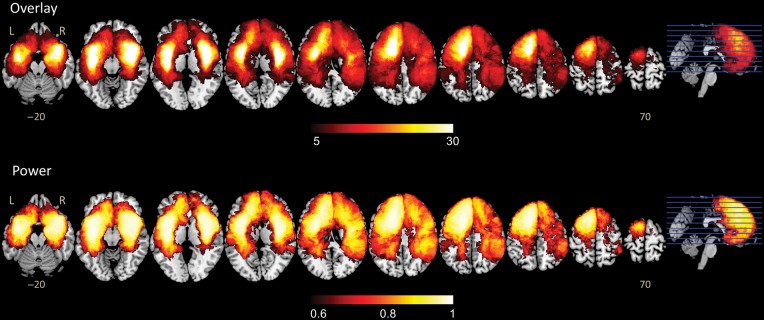
Fig. 2.

Tumor overlap and power map. (A) Overlaps of the brain lesions for all 231 patients. The color range indicates the proportion of overlap from dark (overlap of 5 cases) to light (overlap of ≥30 cases). (B) Power distribution map (0.6–1.0) over all brain regions. Only voxels with high power values (>0.8) were included in the voxel-based lesion-symptom analysis.
