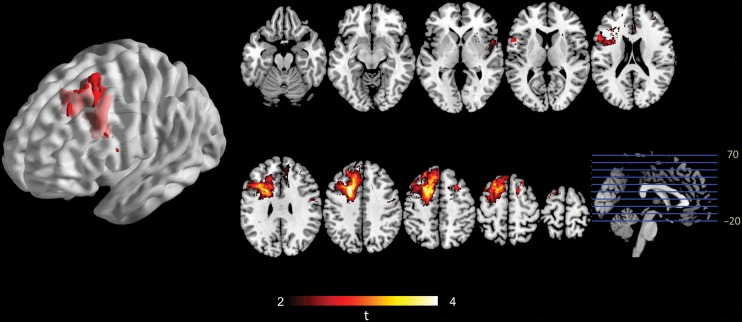
Fig. 3.
VLSM analysis showing seizure-susceptible brain regions associated with LGG. A voxel-wise comparison was performed between patients with and without seizures. The left premotor area is significantly susceptible to tumor-related seizures. The color range indicates the level of t-values from dark to light (least to most significant). Only significant voxels are rendered based on a critical threshold determined by permutation testing (n = 1000, P < .05).

