Fig. 2.
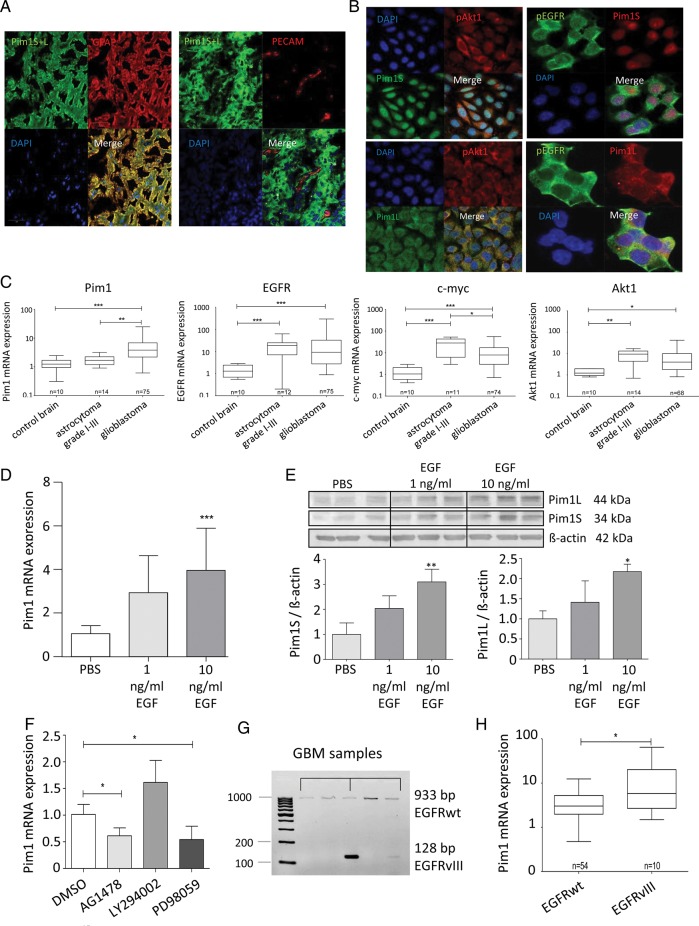
Expression of Pim1, Akt1, EGFR, and c-myc in glioma tissue and GBM cell lines. (A) Cryosections were immunostained with antibodies against Pim1 and GFAP ((left panel) or platelet endothelial cell adhesion molecule (PECAM)/CD31 (right panel). Nuclei are counterstained by the use of DAPI. Note that Pim1 and GFAP are strongly colocalized in glioblastoma cells, whereas no staining of Pim1 was observed in PECAM-positive endothelial cells. (B) Immunofluorescence staining of Pim1S, Pim1L, phosphorylated EGFR (pEGFRTyr1173), and Akt1 (pAkt1Ser473) in glioblastoma cells. Paraformaldehyde fixed LN18 glioblastoma cells stained with antibodies against Pim1S and Pim1L, as well as pAkt1 and pEGFR. Nuclei are counterstained by the use of DAPI. Scale bar represents 20 µm in (A) and (B). (C) Comparison of Pim1, Akt1, EGFR, and c-myc mRNA expression in glioblastoma and low-grade astrocytoma (grades I–III) analyzed by quantitative real-time (RT-)PCR with normalization to 18S rRNA and shown as box plots representing the median as horizontal bars as well as the 5th and 95th percentiles. (D) Regulation of Pim1 mRNA by EGF (1 and 10 ng/mL, 48 h) in LN18 cells was determined by quantitative RT-PCR, mean ± SD of 3 independent experiments. Pim1 mRNA level was normalized to 18S rRNA and is expressed relative to the PBS treated control, which was given a value of 1. (E) Total cell lysates of nontreated and EGF-treated (1 and 10 ng/mL, 48 h) LN18 cells were immunoblotted and stained with antibodies against Pim1S, Pim1L, and β-actin (upper panel) followed by densitometric analysis of signals with normalization of Pim1 protein expression to β-actin (lower panel, Pim1: β-actin ratio). Pim1 protein level is expressed as a proportion of the PBS-treated control cells, which was given a value of 1 (n = 3), mean ± SD. (F) Influence of AG1478 (100 nM), LY294002 (25 µM), and PD98059 (10 µM) on Pim1 expression determined by quantitative RT-PCR. Pim1 mRNA level was normalized to 18S rRNA and is expressed relative to the PBS-treated control, which was given a value of 1 (n = 3), mean ± SD. (G) Representative samples of the analysis of EGFRwt or deletion variant EGFRvIII expression in GBM tissue determined by conventional PCR. (H) Association analysis of Pim1 mRNA level with the expression of EGFRwt or EGFRvIII in glioblastoma shown as box plots representing the median as horizontal bars as well as the 5th and 95th percentiles. *P < .05, **P < .005, ***P < .001.

