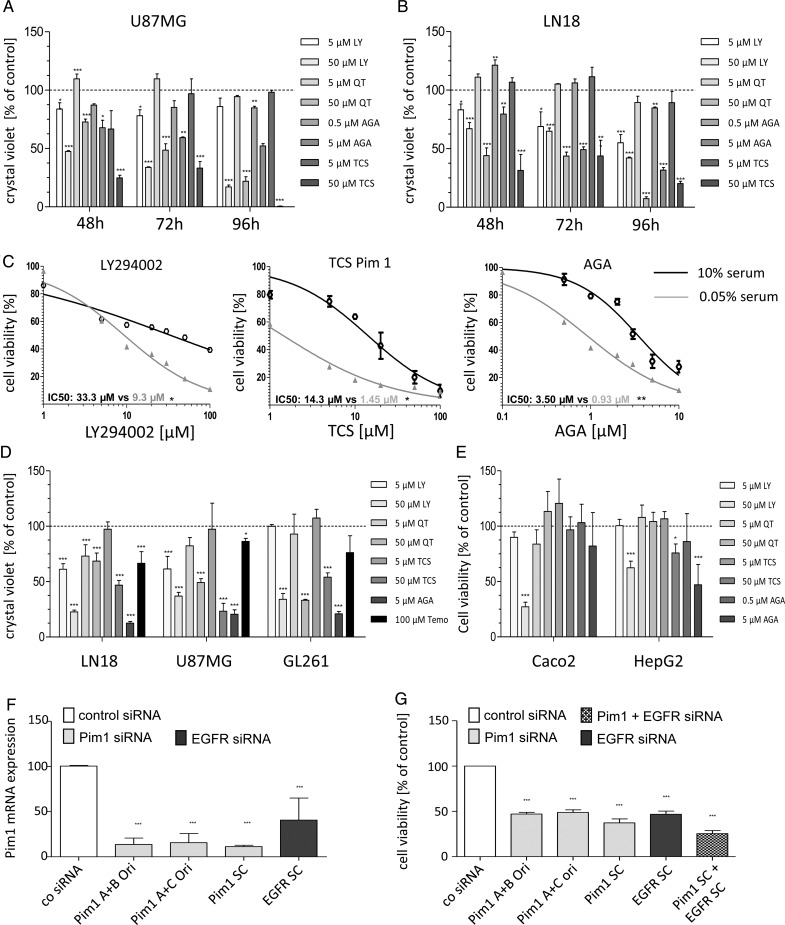
Fig. 3.
Growth analysis of murine and human GBM cell lines after application of different inhibitors. (A and B) Time-dependent effects of PI3K/Pim1 inhibitor LY294002 (LY, 5 and 50 µM), Pim inhibitor QT (5 and 50 µM), selective Pim1 inhibitor TCS Pim 1 (5 and 50 µM), and HSP90 inhibitor AGA (0.5 and 5 µM) on cell viability of human U87MG (A) and LN18 (B). Cell viability was determined 48, 72, or 96 h after application of inhibitors using the resazurin assay (n = 3), mean ± SD. (C) Comparison of cell viability curves of serum starved and control LN18 cells treated with DMSO (as solvent), LY (5 and 50 µM), QT (5 and 50 µM), TCS (5 and 50 µM), and AGA (0.5 and 5 µM). Cell viability was determined using the resazurin assay. Half-maximal inhibitory concentration values were determined by nonlinear regression analysis and compared with Wilcoxon signed-rank test (n = 3), mean ± SD. (D) Crystal violet staining of LN18 and GL261 cells 72 h after application of DMSO (as solvent), LY (5 and 50 µM), QT (5 and 50 µM), TCS (5 and 50 µM), AGA (0.5 and 5 µM), and 100 µM temozolomide (n = 3), mean ± SD. (E) Determination of cell viability using the resazurin assay after treatment of HepG2 and Caco2 cells with DMSO (as solvent), LY (5 and 50 µM), QT (5 and 50 µM), TCS (5 and 50 µM), and AGA (0.5 and 5 µM) for 72 h (n = 3), mean ± SD. (F) Silencing of Pim1 and EGFR by gene-specific analysis. LN18 cells were transfected with either control-, Pim1-, or EGFR-siRNA using Lipofectamine 2000, and 48 h afterward the Pim1 mRNA expression was determined by quantitative real-time PCR with normalization to 18S rRNA. Mean + SD of 4 independent experiments. (G) Cell viability of LN18 cells 72 h after transfection with either control-, Pim1-, or EGFR-siRNA. Cell viability was determined using the resazurin assay (n = 4), mean ± SD. *P < .05, **P < .005, ***P < .001 vs control.

