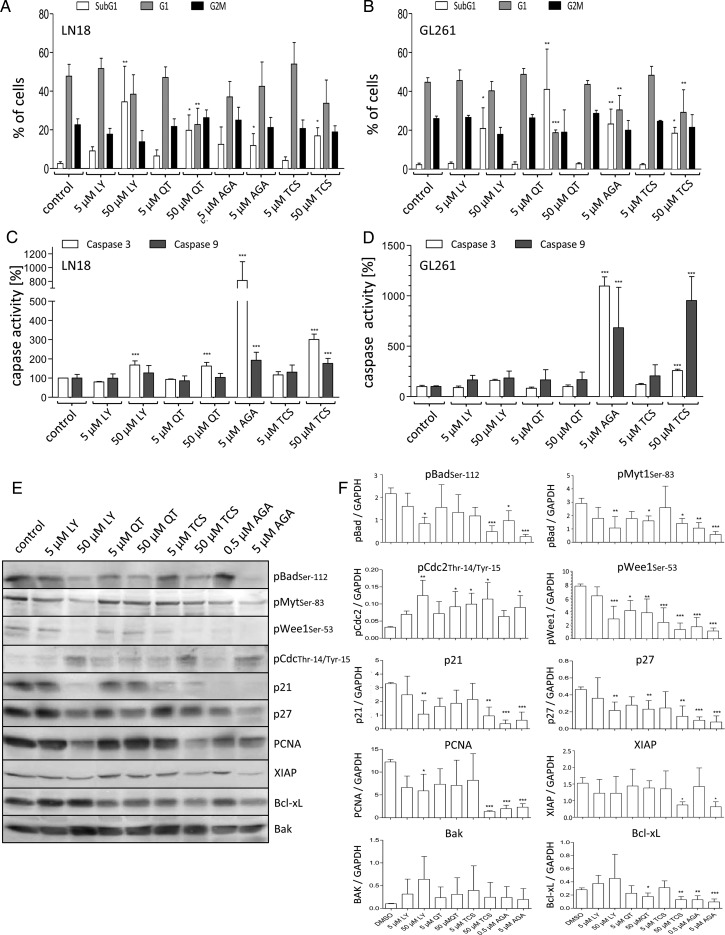
Fig. 4.
Analysis of the cytotoxic potential of HSP90 and Pim1 inhibitors. (A and B) Fluorescence activated cell sorting–based cell cycle analysis using ethanol fixed and propidium stained LN18 and GL261 cells 48 h after application of DMSO (as solvent), LY294002 (LY, 5 and 50 µM), QT (5 and 50 µM), TCS (5 and 50 µM), and AGA (0.5 and 5 µM). (A) Distribution of cells in the subG1 and (B) in the G1 cluster. Mean + SD, n = 4. (C) Determination of caspase-3 activity using a commercially available assay in LN18 and GL261 cells after treatment with DMSO (as solvent), LY (5 and 50 µM), QT (5 and 50 µM), TCS (5 and 50 µM), and AGA (0.5 and 5 µM) for 48 h. Mean + SD, n = 4. (D) Determination of caspase-9 activity using a commercially available assay in LN18 and GL261 cells after treatment with DMSO (as solvent), LY (5 and 50 µM), QT (5 and 50 µM), TCS (5 and 50 µM), and AGA (0.5 and 5 µM) for 48 h. Mean + SD, n = 4. (E and F) Protein extracts of LN18 cells treated with different inhibitors were analyzed by immunoblotting. Forty-eight hours after application of LY (5 and 50 µM), QT (5 and 50 µM), TCS (5 and 50 µM), and AGA (0.5 and 5 µM) LN18 cells were harvested, and (E) protein extracts were immunoblotted with antibodies against pBad (pBADSer112), phosphorylated Myt1 (pMyt1Ser83), phosphorylated Wee1 (pWee1Ser53), phosphorylated CDC2 (pCDC2Thr14/Tyr15), p21, p27, PCNA, XIAP, Bcl-xL, Bak, and GAPDH as loading control. Representative blots of 4 independent experiments. (F) Densitometric analysis of 4 independent experiments analyzed for the respective proteins by immunoblotting. Each target protein level was normalized to GAPDH (target protein:GAPDH ratio), mean + SD. *P < .05, **P < .005, ***P < .001 vs control.

